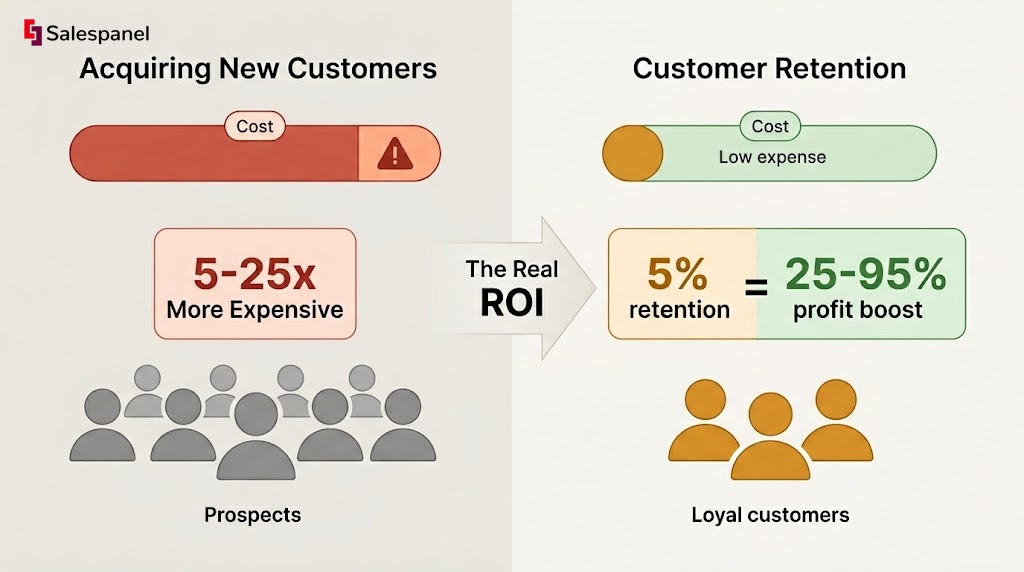
In a world where customer loyalty is won or lost in milliseconds, focusing solely on the first sale is a relic of the past. The strategic imperative has shifted. Businesses that thrive today understand a customer’s true worth not as a single transaction, but as the sum of a long-term relationship. Research consistently shows that acquiring a new customer is 5 to 25 times more expensive than retaining an existing one, and a mere 5% increase in customer retention can boost profits by 25-95%. This isn’t just a number—it’s a fundamental truth.
The central theme of this guide is to demonstrate how calculating Customer Lifetime Value (CLV) transitions your business from a short-sighted, acquisition-focused model to a strategic, retention-driven powerhouse. We will explore the technical formulas, provide practical examples, and show you how to transform this single metric from a historical footnote into a predictive compass that guides your future growth. Understanding CLV is the key to unlocking sustainable profitability.
Why CLV Is Your Most Important Growth Metric
For decades, the finish line was the first sale. Marketing and sales efforts were judged almost entirely on customer acquisition cost (CAC). But this model is fundamentally flawed. It ignores the profound economic impact of customer loyalty. The real goal isn’t just to acquire a customer; it is to understand, predict, and maximize their total potential value over their entire relationship with your company.
This represents a massive strategic shift from an acquisition-at-all-costs mindset to one driven by retention and relationship-building. The data provides a clear case for this change. When you realize that existing customers are your most valuable asset, the question becomes: how do you quantify that asset?
Customer Lifetime Value (CLV) is the metric that answers this question. It represents the total net profit you can reasonably expect from a single customer account over the entire predicted duration of their relationship with you. When you learn how to calculate it, you move past vanity metrics and begin using a predictive tool that shapes durable, long-term success.
From Hindsight to Foresight
At its most basic level, a CLV calculation provides a snapshot of what has already occurred. However, its true power lies in its ability to inform what you do next. It furnishes a data-backed foundation for making smarter, more profitable decisions across your entire organization.
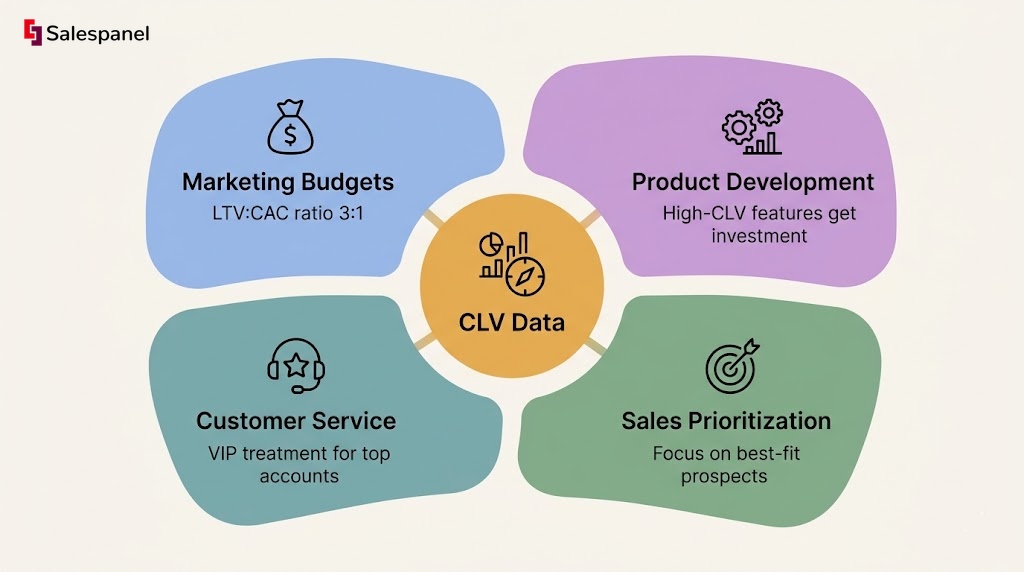
- Marketing Budgets: CLV provides a clear ceiling for your Customer Acquisition Cost (CAC). A healthy LTV/CAC ratio, widely accepted to be 3:1 or higher, is a definitive indicator of a scalable and profitable business model. It tells you exactly how much you can afford to spend to acquire a new customer and still achieve profitability over their lifespan.
- Product Development: By segmenting customers, you can analyze the CLV of users who engage with specific features. If users of “Feature X” have a 25% higher CLV, you have a data-driven mandate to invest further in that area of your product.
- Customer Service: High-CLV customers are your VIPs. The data justifies allocating greater resources—such as dedicated account managers or priority support—to retain them, because you can mathematically prove the ROI of that investment.
- Sales Prioritization: Your sales team can evolve from chasing every lead to strategically focusing on prospects who share the characteristics of your most valuable existing customers. It’s about applying resources with precision, not just volume.
CLV isn’t just another report to file away. It’s a strategic compass. It doesn’t just tell you how you did; it guides every future investment you make in marketing, product, and customer experience. It’s how you build a business with a truly loyal and profitable customer base.
The Foundational CLV Formulas
Before achieving a truly accurate measure of Customer Lifetime Value, you must understand its core components. These foundational metrics are the building blocks that provide a clear, historical view of a customer’s worth to your business.
Think of it as financial forensics: if you don’t understand the individual transactions and behaviors, the final valuation will be flawed. The three primary inputs for a simple—yet surprisingly powerful—CLV calculation are Average Purchase Value, Purchase Frequency, and Customer Lifespan. Each metric tells a distinct part of the customer’s financial story with your brand.
Demystifying the Core Components
What do these technical metrics mean in a practical business context? Let’s dissect each one with clear examples.
Average Purchase Value (APV)
This is the most straightforward piece of the puzzle. It answers the simple question: “When a customer buys something, how much do they usually spend?” It’s a basic average that tells you the typical transaction size for your business.
To calculate this, divide your total revenue over a specified period (e.g., a quarter or a year) by the total number of orders placed during that same timeframe.
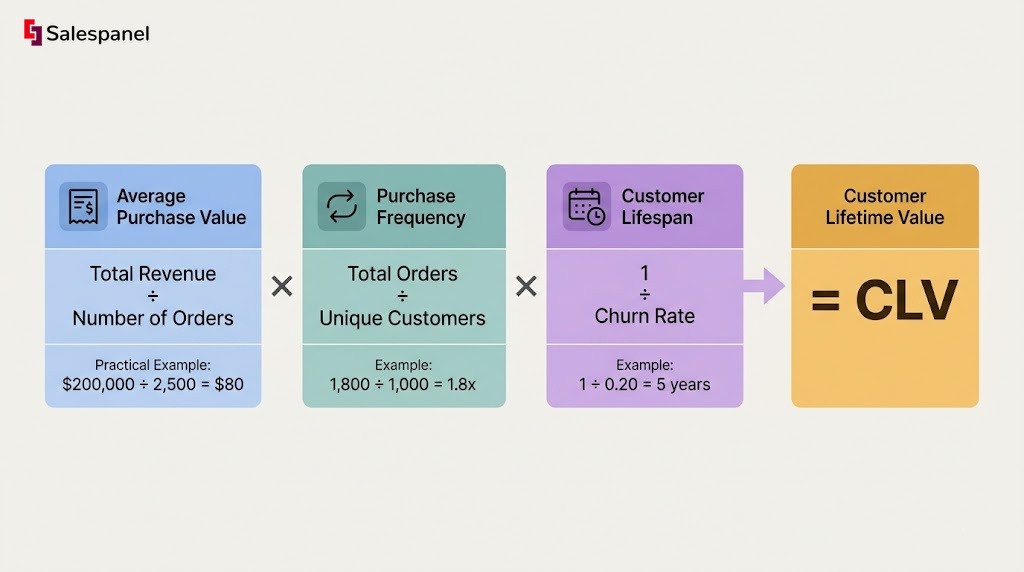
Formula: Total Revenue / Number of Orders = Average Purchase Value
Practical Example (D2C Brand): An online clothing store generated $200,000 in revenue from 2,500 individual orders last year. Their APV is $80 ($200,000 / 2,500). This figure is critical for assessing the immediate ROI on marketing campaigns and sales promotions.
Purchase Frequency
Next, you must determine how often the average customer returns to make a purchase. This metric, Purchase Frequency, is a direct measure of customer loyalty and product stickiness. A high frequency rate is a strong positive indicator, suggesting you have a compelling product and a dedicated customer base.
To find it, you’ll divide the total number of orders by the number of unique customers over that same period.
Formula: Total Number of Orders / Number of Unique Customers = Purchase Frequency
Practical Example (SaaS Platform): A SaaS company with 1,000 unique customers processed 1,800 total transactions (including monthly subscriptions and add-on purchases) last year. Their Purchase Frequency is 1.8, indicating the average customer makes nearly two distinct purchases annually.
Customer Lifespan
Finally, Customer Lifespan quantifies how long the average customer remains active before they churn. It is arguably the most revealing metric for the long-term health of your business, serving as a direct reflection of customer satisfaction and retention.
Calculating this can be as simple as averaging the tenure of all past customers, but a common and effective shortcut is to use your churn rate.
Formula: 1 / Churn Rate Percentage = Customer Lifespan
Practical Example: If your annual churn rate is 20% (or 0.20), your average Customer Lifespan is 5 years (1 / 0.20).
These three core metrics flow together logically to construct a complete picture of a customer’s total value.
This simple visual shows a clear path: you start with the value of a single transaction, factor in their buying habits over time, and finish with the total length of the relationship.
To make this even clearer, here’s a quick table summarizing these key inputs.
Core Components of the Simple CLV Formula
| Metric | What It Measures | Example Calculation |
|---|---|---|
| Average Purchase Value (APV) | The average revenue generated per order. | $200,000 Total Revenue / 2,500 Orders = $80 APV |
| Purchase Frequency | How often a customer makes a purchase in a given period. | 1,800 Orders / 1,000 Unique Customers = 1.8 |
| Customer Lifespan | The average length of time a customer stays with your business. | 1 / 0.20 (20% Churn Rate) = 5 Years |
With these three metrics in your back pocket, you’re ready to calculate a baseline CLV that can immediately start informing your strategy.
Putting It All Together: A Practical Example
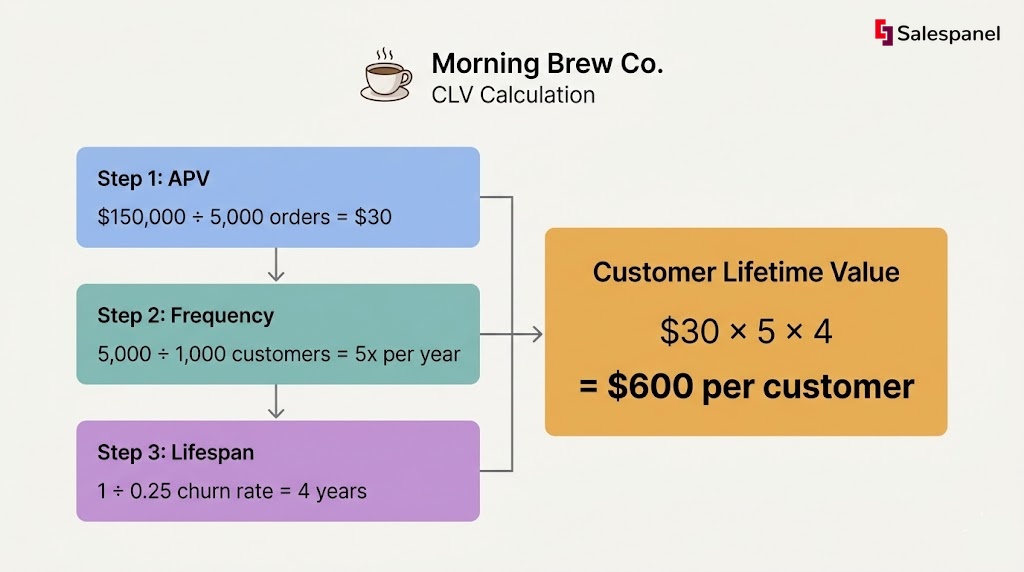
Now, let’s synthesize these metrics into a real-world scenario. Imagine we operate an online coffee subscription service named “Morning Brew Co.”
First, we gather our data from the past year:
- Calculate APV: Morning Brew Co. generated $150,000 in revenue from 5,000 orders. Their APV is $30 ($150,000 / 5,000).
- Calculate Purchase Frequency: Those 5,000 orders were placed by 1,000 unique customers. Their Purchase Frequency is 5 orders per year (5,000 / 1,000).
- Calculate Customer Lifespan: The company has a measured annual churn rate of 25%. Their average Customer Lifespan is therefore 4 years (1 / 0.25).
With these figures, we can plug them into the simple CLV formula.
CLV Formula: Average Purchase Value x Purchase Frequency x Customer Lifespan
For Morning Brew Co., the calculation is: $30 (APV) x 5 (Frequency) x 4 (Lifespan) = $600.
This result tells us that, on average, each customer is worth $600 in total revenue to Morning Brew Co. over their entire relationship. This historical CLV provides an immediate, tangible benchmark for strategic planning in marketing spend, customer service investment, and more.
You can also layer in profit margin for a more nuanced view. For instance, say a company does $1,000,000 in annual sales from 40,000 orders across 15,000 unique customers. Their Average Order Value (AOV) is $25, and purchase frequency is about 2.67 times per year, making the annual customer value $66.75. If that company has a 30% gross margin, the annual profit per customer is actually $20.03. Multiply that by an average lifespan of 5 years, and you get a predictive, profit-centric CLV of around $100.15.
Historical vs Predictive CLV Models
The basic CLV formulas we’ve covered provide a valuable snapshot of past performance. They tell the story of where your business has been, which is a crucial piece of the strategic puzzle.
But in a market that shifts quarterly, relying solely on this rearview mirror is a significant strategic liability.
To truly master how to calculate customer lifetime value for future growth, you must look beyond what has already transpired. This is where the critical distinction between historical and predictive CLV models emerges. Both aim to answer the same fundamental question—”What is this customer worth?”—but they approach it from completely different points in time.
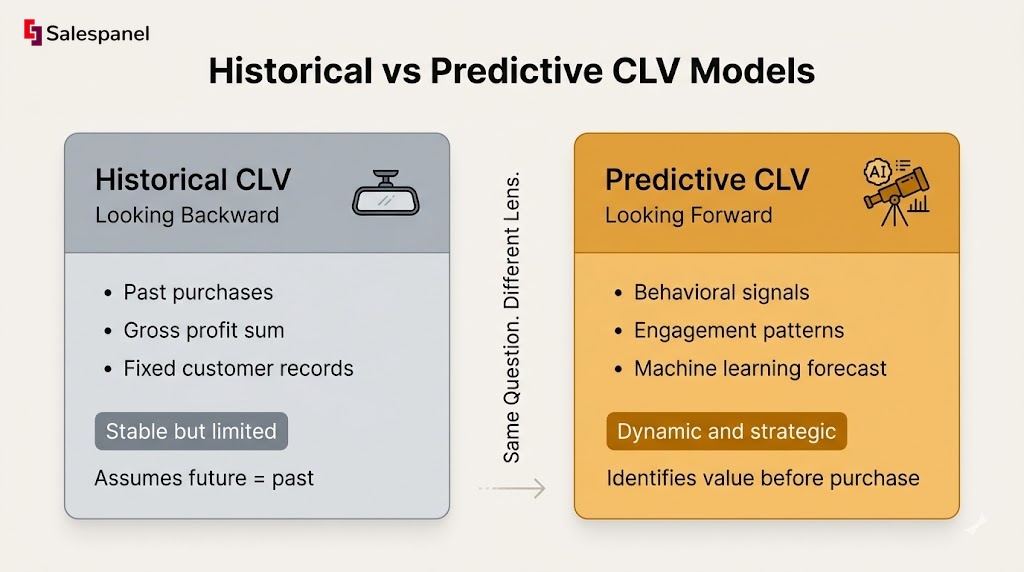
The Limitations of Looking Backward
Historical CLV is straightforward: you sum the gross profit from all of a customer’s past purchases. It’s a simple, factual, and retrospective number. For a business with an extremely stable customer base and predictable buying habits, this model can offer a decent baseline.
However, its simplicity is also its greatest weakness. The historical model is built on one massive, flawed assumption: that the future will mirror the past exactly. It cannot account for critical variables such as:
- Shifts in customer behavior: A customer’s needs, budget, or priorities change over time, altering their purchasing patterns.
- Market dynamics: New competitors emerge, economic conditions fluctuate, and industry trends evolve, all of which impact customer behavior.
- Product evolution: When you launch new features, updates, or pricing tiers, you change how customers interact with your brand and what they are willing to spend.
Consider a fast-growing tech company. A purely historical CLV would be deeply misleading. Customers acquired after a major product launch will likely behave very differently from those who signed up a year prior. A historical model would aggregate them, masking the true potential of their newest—and possibly most valuable—users.
The Power of Forward-Looking Valuation
Predictive CLV models, in contrast, are designed to forecast a customer’s future value. Instead of merely summing past transactions, these models employ statistical techniques and machine learning algorithms to analyze patterns and predict what a customer is likely to do next.
This is the technical leap that transforms CLV from a simple reporting metric into a dynamic, strategic tool. It moves beyond raw transaction data to incorporate a much richer set of inputs.
These models generally fall into two camps, reflecting different market realities and data availability. The historical method, which sums up past revenue minus costs, is fine for businesses with long, stable customer records—think an established subscription service tracking payments over three years. But predictive models use machine learning to analyze purchase frequency, order values, and engagement patterns to forecast future value. This makes them far more responsive for dynamic markets like e-commerce or SaaS.
By analyzing behavioral signals—not just purchase history—predictive models can identify high-value customers long before their spending patterns fully mature. This foresight provides a significant competitive advantage.
Key Inputs for Predictive CLV
Predictive modeling leans on a much broader dataset to make its forecasts. The specific inputs will vary, but they often include a mix of these:
- Transactional Data: The classic RFM (recency, frequency, monetary value) of purchases is still a foundational element.
- Engagement Signals: This is where it gets interesting. We’re talking website visit frequency, email open rates, feature adoption within a SaaS product, or even the number of support tickets submitted.
- Firmographic/Demographic Data: For B2B, this might be company size or industry. For B2C, it could be age or location.
- Churn Propensity Scores: A calculated score that estimates the likelihood a customer will stop doing business with you.
A modern B2B platform can combine these elements to build an incredibly powerful predictive model. For instance, website visitor tracking from Salespanel can capture crucial engagement signals, like how often a prospect from a target account visits your pricing page.
When you feed that behavioral data into a predictive CLV model, it helps you spot high-potential leads before they even make their first purchase. This idea—using deep behavioral insights to anticipate future value—is the core of building a truly proactive growth strategy.
Using Cohort Analysis for Deeper Insights
Calculating a single, company-wide CLV is a valid starting point, but it often conceals more than it reveals. That blended average treats every customer identically, whether they are a loyal advocate or a one-time buyer who churned immediately. This masks the crucial trends that actually drive value in your business.
To move beyond this one-dimensional view, you must segment your customers. This is where cohort analysis becomes your most powerful analytical tool. It is a method for grouping customers based on shared characteristics, allowing you to track and compare their behavior and value over time.
Instead of viewing your customer base as a monolith, cohort analysis allows you to dissect it into distinct groups, providing a more granular—and therefore more actionable—understanding of customer lifetime value.
What Is a Customer Cohort Anyway?
In technical terms, a cohort is a group of users who share a common, defining characteristic. This trait is often time-based (e.g., all customers who signed up in a specific month), but it can also be tied to a specific behavior or acquisition source. Analyzing these groups separately helps you pinpoint exactly which strategies are working and which are not.
Common cohorts you can build include:
- Acquisition Cohorts: Grouping customers by the month or quarter they made their first purchase (e.g., the “January 2024 Cohort”).
- Behavioral Cohorts: Segmenting users based on an action they took, such as signing up for a free trial, using a specific feature, or downloading an ebook.
- Channel Cohorts: Grouping customers by the marketing channel that acquired them—such as organic search, paid social media, or a referral campaign.
By isolating these groups, you can compare their CLV and uncover some pretty powerful insights. You might discover that customers you acquired in Q4 have a 20% higher CLV than those from Q1, which should immediately make you dig into what made your holiday campaigns so successful.
Cohort analysis is all about segmenting customers by shared characteristics—like acquisition date or campaign source—and tracking their value over time. For example, by grouping customers from a specific promotion and watching their purchase habits, you can see which marketing efforts bring in the best long-term value. In fact, data often shows that cohorts from personalized marketing campaigns can have 20-30% higher lifetime values than those from generic outreach.
A Practical Example of Cohort Comparison
Let’s observe this in a practical scenario. Imagine a B2B SaaS company trying to determine which acquisition channels yield the most valuable customers. They decide to compare the CLV of two distinct cohorts acquired over the last year:
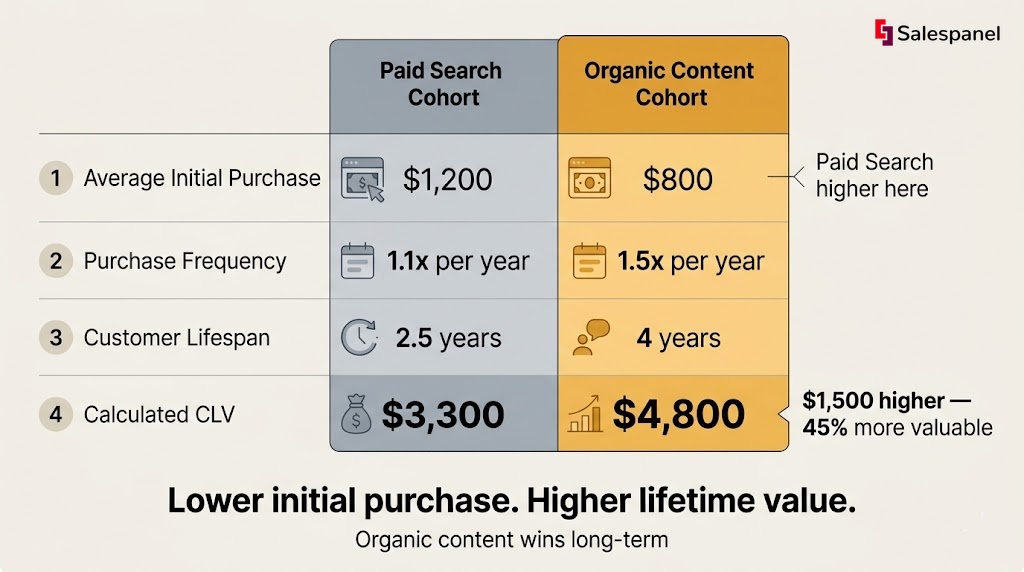
- Paid Search Cohort: Customers acquired through their Google Ads campaigns.
- Organic Content Cohort: Customers who converted through blog posts and SEO efforts.
After 12 months, they analyze the data. Here are the findings:
| Metric | Paid Search Cohort | Organic Content Cohort |
|---|---|---|
| Average Initial Purchase | $1,200 (Higher tier plan) | $800 (Lower tier plan) |
| Average Purchase Frequency | 1.1x per year (Few upgrades) | 1.5x per year (More add-ons) |
| Average Customer Lifespan | 2.5 years | 4 years |
| Calculated CLV | $3,300 | $4,800 |
The results are analytically profound. At first glance, the paid search cohort appears more valuable due to the higher initial purchase value. However, the organic content cohort is the decisive long-term winner. These customers are more engaged, purchase more add-ons, and exhibit significantly better retention.
Their CLV is a remarkable $1,500 higher per customer—a difference of over 45%.
This single insight is sufficient to reshape the company’s entire marketing strategy. They now possess a data-backed justification to double their investment in content marketing, armed with the knowledge that it attracts customers who deliver far greater lifetime value. This exemplifies the power of transitioning from a simple average to a segmented, cohort-based analysis.
Putting Your CLV Data to Work
Calculating your customer lifetime value is a critical first step, but the number is useless if it remains confined to a spreadsheet. Its real power is not as a historical record, but as a strategic tool that actively shapes your sales and marketing operations. The magic happens when you move from knowing your CLV to using it to drive measurable, sustainable growth.
This is the moment that connects the “how” of the calculation to the “what now” of strategic implementation. The objective is to get this data out of the analytics department and into the hands of your front-line teams, transforming it from a static metric into a dynamic revenue driver. When you operationalize your CLV data, you stop making assumptions and start making informed decisions that directly boost your bottom line.
Segmenting for High-Value Engagement
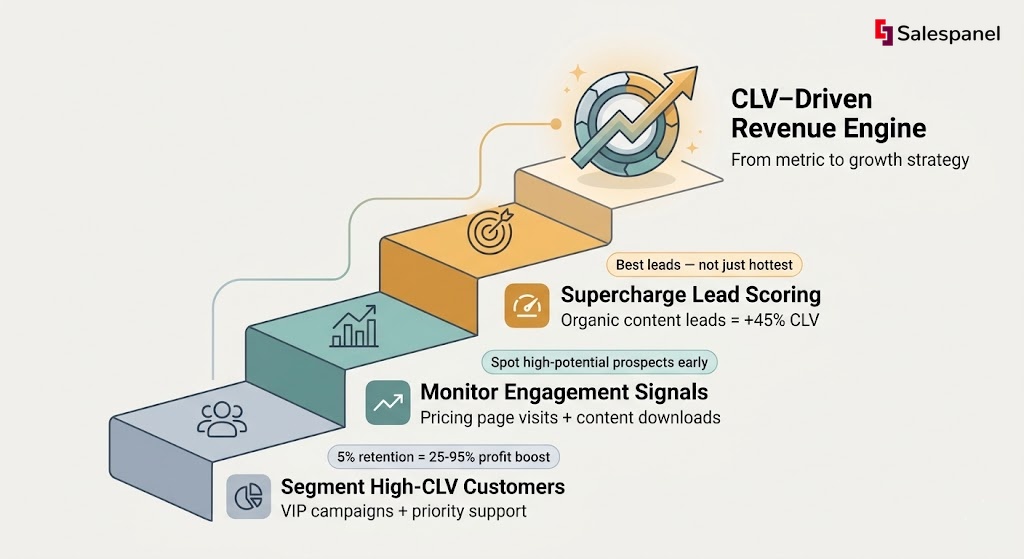
One of the most immediate applications of your CLV analysis is the creation of smarter audience segments. A single, company-wide CLV papers over the vast differences within your customer base. By identifying and isolating your high-CLV customers, you can create a specific audience for targeted, high-touch marketing campaigns.
These are the customers who have earned your most intensive efforts. Instead of a one-size-fits-all approach, you can now confidently allocate more resources to ensure their retention and satisfaction.
- Exclusive Content: Provide early access to new features or invite them to exclusive webinars with your product leadership.
- Personalized Outreach: Craft email campaigns that acknowledge their loyalty and offer solutions tailored to their specific use cases.
- Proactive Support: Tag these customers in your CRM to ensure they receive priority support, transforming a good experience into an exceptional one.
Putting CLV data into action means you stop marketing to everyone and start investing in the relationships that actually matter. It’s the difference between shouting into a void and having a meaningful conversation with your best customers.
This kind of strategic focus yields significant returns. A tiny 5% increase in customer retention can boost profits by a staggering 25% to 95%. By concentrating your efforts on high-CLV segments, you’re pulling the exact levers that lead to that kind of profit growth.
Monitoring Engagement from High-Potential Prospects
Your CLV data isn’t just for managing current customers; it’s a blueprint for identifying your next major accounts. By analyzing the traits and behaviors of your current top-tier customers, you can build a predictive profile of what an ideal prospect looks like before they even make a purchase. This is where behavioral tracking becomes an indispensable tool.
For example, website visitor tracking from Salespanel allows you to see precisely how prospects are interacting with your digital assets. You can monitor for engagement signals that indicate high potential, such as:
- Multiple visits to your pricing page from the same company within a short timeframe.
- Significant time spent on specific feature pages that your high-CLV customers frequently use.
- Downloads of advanced content like technical whitepapers or in-depth case studies.
When you identify a prospect exhibiting these behaviors, you have a data-backed rationale to engage. This empowers your sales team to conduct timely, personalized outreach long before a competitor is even aware that the prospect is in the market. You are essentially using past CLV insights to predict and influence future value.
Supercharging Your Lead Scoring Framework
Perhaps the most powerful way to operationalize CLV data is to integrate it directly into your lead scoring model. Traditional lead scoring often relies heavily on demographic data (like company size or industry) and basic engagement metrics (like email opens). While a decent start, this approach can miss the subtle behavioral nuances that signal long-term value.
By incorporating your CLV insights, you can create a far more intelligent and predictive system. For example, if your cohort analysis demonstrated that customers acquired through organic content have a 45% higher CLV, you can assign more points to leads originating from your blog. It’s a simple, data-driven adjustment.
Salespanel’s lead scoring framework allows you to put this intelligence into practice immediately. You can establish rules that automatically increase a lead’s score based on the very behaviors your CLV analysis has proven to be valuable.
This ensures your sales team isn’t just chasing the hottest leads, but the best leads—those with the highest probability of becoming your most profitable customers. This tight alignment between marketing insights and sales execution is the core of an effective, data-driven revenue strategy.
Common CLV Questions Answered
Once you start calculating customer lifetime value, the real work begins. Moving from theory to practice always brings up practical questions and a few common hurdles. This is where you refine your approach and turn a simple metric into a powerful strategic tool.
Let’s walk through some of the most frequent questions we hear to give you clear, actionable guidance as you put CLV to work.
How Often Should I Recalculate CLV?
There’s no single right answer here—it really depends on your business model and how quickly your market moves. But there are some solid guidelines.
If you’re running a high-transaction e-commerce brand, you’ll want to recalculate quarterly, maybe even monthly. This lets you quickly see how recent marketing campaigns, pricing tweaks, or seasonal trends are affecting customer value.
On the other hand, a SaaS company with annual contracts could be perfectly fine with a semi-annual or even annual calculation. The key is to run the numbers whenever you make a significant strategic shift in your pricing, product, or marketing. That’s the only way to accurately measure its true impact on long-term value.
What Are the Most Common CLV Mistakes?
I’ve seen a few common pitfalls trip people up, and they can seriously undermine the accuracy and usefulness of your CLV calculations. Avoiding them is critical.
The biggest mistake is focusing on revenue instead of profit. You absolutely have to subtract customer acquisition costs (CAC) and the cost of goods or services sold. A high-revenue customer who is expensive to serve might actually be less valuable than a lower-revenue, low-cost one.
Another frequent error is relying on a single, company-wide CLV number. This blended average just hides all the important differences between your customer groups.
The most actionable insights always come from segmentation. You have to use cohort analysis to compare CLV across different acquisition channels, sign-up periods, or initial product choices. That’s how you uncover what truly drives long-term value.
Finally, don’t get stuck using only historical data, especially in a fast-moving market. You need to balance past performance with predictive analysis to get a more accurate and forward-looking view.
Can a New Business Calculate CLV with Limited Data?
Yes, you definitely can, but it requires a different mindset. It’s all about making educated assumptions and leaning on industry benchmarks to get started. You can’t calculate a purely historical CLV without a deep well of data, but you can build a solid foundational model.
Start by digging into data from comparable companies in your industry to get a baseline for a few key metrics:
- Average purchase value: What’s a typical transaction size for similar products?
- Purchase frequency: How often do customers in your market tend to buy again?
- Churn rate: What’s a realistic churn rate for a new business in your vertical?
You can also survey your first wave of customers to understand their purchase intent and gather some qualitative feedback. The most important part? As your business grows and you collect your own data, you must constantly update and refine your CLV model, systematically swapping out those initial assumptions with your actual performance numbers.
By moving beyond calculation and into activation, you transform CLV from a simple metric into a strategic driver. At Salespanel, our philosophy is built on using deep data insights to foster valuable, long-term customer relationships. We provide the tools to not only track engagement but also to act on it, helping you attract and retain the customers who matter most. Explore our resources to build a data-driven growth strategy at https://salespanel.io/resources.