10 Critical ABM Metrics You Should Be Tracking For Success
Studies show that the average B2B sales cycle is between 1-6 months. Not to mention that your sales representatives must overcome a number of obstacles before your ideal client chooses to buy and swipes their card for the purchase. This is where the need for a highly personalized and targeted approach aligning marketing and sales efforts to ultimately increase conversions arises.
Enter account-based marketing. Here the traditional marketing funnel is flipped. Using ABM, companies can identify high-value prospects and engage them with the right messaging that enables trust and relationship-building, leading to an increase in the likelihood of converting a potential customer. In fact, research indicates that 84% of marketers feel that their ABM efforts have been very successful in the last 12 months. Now the question that arises is, how can you prove this to your company’s management or CEO?
To do this, you need to track your ABM metrics. Not measuring the impact of your ABM campaigns can lead to a lot of resources being spent counterproductively. The right ABM metrics may determine the effectiveness of your account-based marketing strategy over time by measuring the appropriate KPIs, which indicate if you are targeting the correct prospects, allocating the appropriate funds for sales and marketing, and offering a first-rate buyer (and subsequently, customer) experience.
In this blog, we will highlight the top 10 ABM metrics your business should be tracking for measuring the effects of your account-based marketing campaign on your sales and revenue. But first, let’s define what account-based marketing is.
What is Account-Based Marketing?
In a traditional marketing system, businesses take a spray-and-pray approach. The top of the funnel is the awareness stage where prospects are made aware of your product and services. However, B2B marketing today is focused on creating hyper-personalized experiences for one customer — considering every potential consumer as a market unto themselves. Thus, in order to differentiate themselves from competitors, brands must focus on individual accounts and create exclusive experiences for them. This is what ABM does!
Account-based marketing (ABM) is a form of marketing where you identify high-value accounts and target your campaigns toward them.
With ABM, 65% of B2B companies are seeing increased opportunity lead quality, volume, or both, according to recent research. Also, 70% of B2B marketers report a partial or complete sales and marketing alignment.
Now, with ABM essentially being the reverse of traditional marketing, the metrics that need to be tracked can somewhat differ. Nonetheless, your ability to track these metrics accurately would dictate the success or failure of your campaigns.
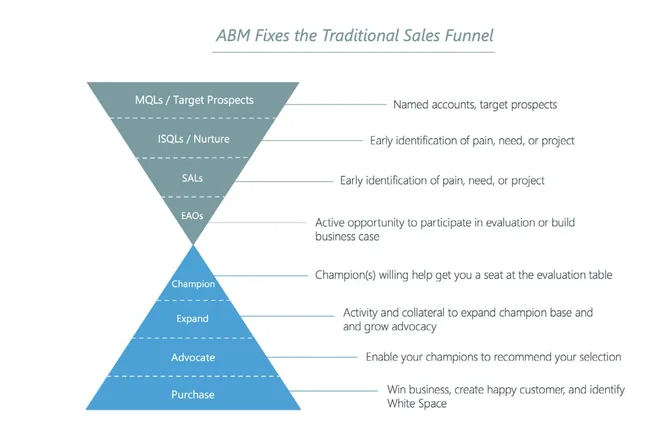
Image Source: Hubspot
How Does Tracking Account-Based Marketing Metrics Help?
Both marketing and sales teams can better match their goals and strategies with overall business objectives by using ABM metrics and KPIs. They act as a guide, assisting the team in determining what needs more attention. The right ABM metrics give marketing teams a standard for success and let them track their progress over time, regardless of the goal — growing income from current customers, breaking into new markets, or enhancing consumer loyalty.
For instance, by using KPIs like target account revenue, average transaction size, and customer lifetime value, marketing teams may evaluate the return on investment of their ABM initiatives. This helps them make data-driven decisions and more efficiently allocate resources if they are aware of the financial consequences of their work.
On the other hand, metrics like engagement levels, conversion rates, and pipeline progression offer a detailed view of campaign performance. By analyzing these metrics, marketers can iterate on messaging, target key decision-makers, and optimize the customer journey. This data-driven approach enhances targeting precision, improves lead quality, and ultimately increases the likelihood of closing deals with high-priority accounts, contributing to the overall success of the ABM strategy.
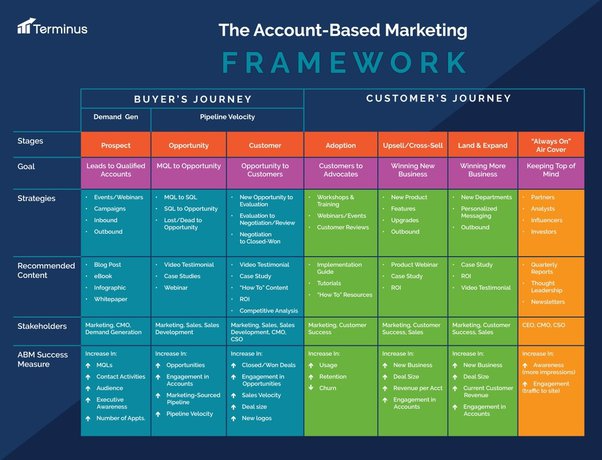
Image Source: Terminus
10 ABM Metrics to Track For Measuring the Success of Your Campaigns
Without further ado, let’s dive into this list of the top 10 ABM metrics you should be measuring for gauging campaign success for your business:
1. Total Addressable Market
Total Addressable Market (TAM) refers to the complete market demand that now exists for your products or services. By calculating this measure, you can determine the portion of the market that you must win over through ABM sales to reach your revenue targets.
The formula for calculating TAM is as follows:
Total Addressable Market = (Total No. of Potential Customers) * (Annual Contract Value)
There are three ways you can calculate TAM:
- Top-down Approach: Leveraging industry data to identify current market demand in different market segments within your industry.
- Value-based Theory: Taking the present and future prices that potential buyers could be prepared to pay for your product into account.
- Bottom-down Approach: Multiplying past sales averages by the entire number of potential clients in your market.
2. Average Deal Size
Average Deal Size (ADS) is the metric that measures the average value of each deal closed with a target account in comparison with those converted from other marketing initiatives such as demand generation, outbound lead generation, etc.
Since individualized and targeted efforts concentrate on high-value accounts, they frequently result in larger sales, which makes it easier to assess how ABM affects deal size. Businesses can learn how much their clients are willing to spend or invest in their goods and services by monitoring the average deal size.
ADS is computed by dividing the total value of all closed deals by the total number of closed deals over a specific period. It is commonly computed monthly or quarterly.
The formula for calculating ADS is as follows:
Average Deal Size = (Total Value of Deals Closed) / (Total No. of Deals Closed)
3. Target Accounts Visiting the Website
This metric indicates the number of target accounts (i.e. ideal prospects) that your ABM campaign has directed to your website. These interactions could come from various sources, including search, social media, emails, paid ads, and more.
This metric helps businesses gauge the success of the ABM campaign. A lower number of target prospects visiting the website could prompt you to evaluate your messaging, personalization tactics, marketing channels, and more, leading to a refined strategy that moves your leads through the sales pipeline.
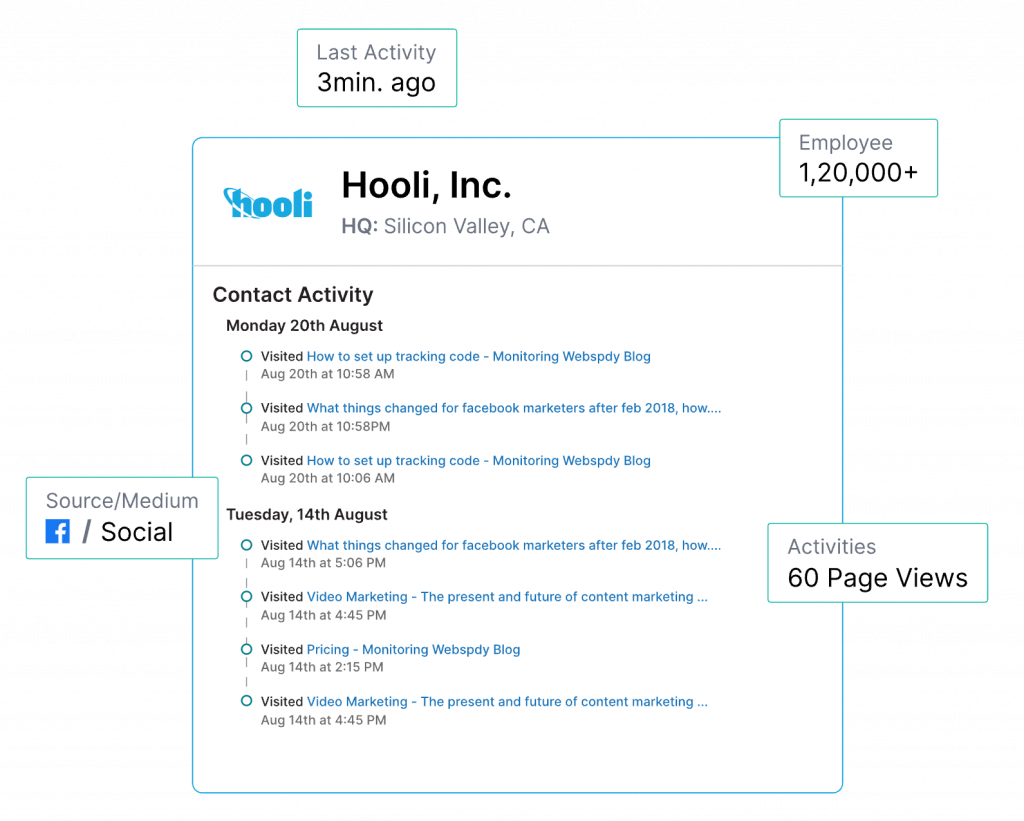
A tool like Salespanel reveals accounts from your website (even if the visitor is anonymous) and can tell you if your target accounts are landing on your website from your campaigns. With Salespanel, you can track and identify leads from target accounts that resemble your ideal customer persona (ICP). Based on profile data, you can then segment and qualify high-value prospects and send personalized messages through live chat based on where they are in their customer journey.
Once you start tracking the number of target accounts you hit with your content, you can also get a clearer idea about who they are and how they operate, which can further inform your marketing and sales initiatives in the future. Thus, it’s critical to monitor it frequently and modify your ABM strategies as necessary.
4. Customer Acquisition Cost
Customer Acquisition Cost (CAC) indicates the total marketing and sales costs paid by a company to sign a new customer. ABM may incur higher expenses than mass marketing strategies due to its highly individualized nature. Thus, it’s critical to keep a careful eye on the cost of client acquisition (CAC).
The entire cost of sales and marketing added together, then divided by the total number of new customers obtained, gives you the customer acquisition cost.
The formula for calculating CAC is as follows:
Customer Acquisition Cost = (Cost of Marketing + Sales Initiatives) / New customers Acquired
To minimize CAC, you can try standardizing your marketing and sales processes, wherever feasible, without compromising the caliber of the customer experience. For instance, your sales team will save time in curating and producing content for each lead if you design standardized sales enablement materials that are specific to each of your top ABM customer categories.
Note: Comparing the cost of customer acquisition (CAC) with a customer’s lifetime brand value (CLV) will reveal business profitability. If CAC is higher than CLV, it is time to re-evaluate your marketing and sales strategies that lower CAC.
5. Customer Lifetime Value
Customer Lifetime Value (CLV) indicates the total amount of money a customer spends with your business over the course of their relationship. CLV shows you whether your organization will make money over the long run from the time and money you invest in acquiring new customers.
Measuring this parameter is crucial since it helps businesses assess the value of their customers and determine how much to spend on bringing in new ones or keeping hold of current ones. The less money you need to spend on acquisition fees, the higher will be the client lifetime value.
Calculating CLV can be tricky; however you can start by multiplying the average purchase value with the average buy frequency rate. Next, you need to multiply that product by the typical customer lifetime, and you will end up with the customer lifetime value (CLV).
The formula for calculating CLV is as follows:
Customer Lifetime Value = (Average Monthly Recurring Revenue) * (Average Time a Customer Stays With a Business)
6. Conversion Rate
Conversion Rate refers to the percentage of deals in your sales pipeline that you close for revenue. This metric is the most straightforward way to gauge the success of your ABM campaign.
The formula for calculating conversion rate is as follows:
Conversion Rate = (Total No. of Target Accounts Converted) / (Total No. of Target Accounts in the Pipeline) * 100
A good conversion rate can help you determine which components of your ABM campaigns are effective or otherwise over time. Businesses can also figure out the inefficiencies in the sales process and compute the conversion rate at every stage of the sales funnel. This may help them maximize outcomes and improve their marketing and sales efforts.
To improve your conversion rate, you should target accounts that fit your ICP criteria, personalize messaging to address their pain points, develop a multi-channel engagement strategy, and monitor every individual lead throughout their customer journey. You can also measure related KPIs such as the engagement vs. conversion rate and conversion rate by marketing channel. Both can reveal crucial areas of improvement that can help you close more deals.
7. Sales Velocity
Sales (or Pipeline) Velocity reveals the speed at which a particular lead progresses down your sales pipeline. A lower sales velocity would indicate that there are points of friction to be amended for a smoother sales process.
The formula for calculating sales velocity is as follows:
Sales (or Pipeline) Velocity) = (No. of Sales-Qualified Leads in the Pipeline) * (Conversion Rate) * (Average Deal Size) / (Length of the Sales Cycle)
One of the best ways to identify which campaigns generate the most quality leads and assist them in moving through the funnel more rapidly is to track the velocity at which leads pass through your pipeline. Understanding this metric will enable you to determine which marketing tactics convert the best. This indicator can also help you determine whether the costs and resources associated with a specific sales effort are worthwhile in terms of acquiring new customers.
To increase sales velocity, you can increase lead quality, determine why customers are leaving mid-way through the sales process, and align marketing and sales teams to make messaging relevant and consistent for prospects.
8. Churn Rate
Churn Rate refers to the rate at which a company loses its customers.
This metric makes it possible to take proactive steps to maintain and grow accounts by pointing out any problems or gaps in the various ABM initiatives. It also tells marketing and sales professionals about the health of the customer base and how well any retentive nurturing is working.
The formula for calculating churn rate is as follows:
Churn Rate = (No. of Customers Lost) / (Total No. of Customers at the Start of Time Period) * 100
To decrease the churn rate for your business, you can try focusing on relationship-building with customers, providing better customer service, offering personalized solutions, and over-delivering on your advertisements.
9. Length of Sales Cycle
The Length of Sales Cycle metric defines the average time it takes to conclude deals with target accounts. It helps in assessing how well ABM tactics work to quicken the sales cycle and reduce the amount of time needed to turn target clients into paying customers.
The length of sales cycle differs from one industry to another. However, it directly impacts business revenue and profitalibility, hence, it works as a clear indicator of the overall success of the company. A longer than usual sales cycle usually means that there are inefficiencies within the sales process, which need to be fixed.
The formula for calculating the length of sales cycle is as follows:
Length of Sales Cycle = (Total No.of Days Taken to Close Each Deal) / (Total No. of Deals Closed)
10. Post Sale Metrics
Post-sale metrics include KPIs like customer satisfaction and retention rates, customer feedback scores, net promoter scores, and more. These metrics are critical for ABM performance evaluations.
Ultimately, every business wants to make sure that the pre-sale work pays off in the form of a satisfied customer base and steady revenue development for the company. Gauging these metrics provide a clear picture of how well you are developing long-term relationships and brand advocacy for the future.
Final Thoughts
Knowing the impact of your campaigns on your company’s success requires tracking its key performance indicators (KPIs). If not, you risk accruing significant marketing costs with no worthwhile results. ABM is a tried-and-true methodology for driving business growth, but you need help tracking every aspect of its campaigns, including engagement, response, and outcome before you launch them. This is where Salespanel fits perfectly into your tech stack.
While its de-anonymization feature enables marketers to have a complete view of those visiting your website at not only an account level but also individually, its robust integrations with CRMs and advertising platforms allow marketing teams to identify high-value prospects and target them with personalized messaging. Not to mention, with Salespanel, you can track entire customer journeys and help marketing and sales teams align operations for lead conversion.
Leverage Salespanel to measure the success of your ABM campaigns. You can start by checking out their 14-day free trial today!
Sell more, understand your customers’ journey for free!
Sales and Marketing teams spend millions of dollars to bring visitors to your website. But do you track your customer’s journey? Do you know who buys and why?
Around 8% of your website traffic will sign up on your lead forms. What happens to the other 92% of your traffic? Can you identify your visiting accounts? Can you engage and retarget your qualified visitors even if they are not identified?