B2B Reporting 101: All You Need To Know
Updated on 10th August, 2024
It is not possible to fight a war and win a war without knowing what exactly is happening at various places and levels. Similarly, when you run your B2B business, you need to know what is happening and where and what is contributing to revenue. Regular and relevant reporting enables one to understand the circumstances better which in turn lets one take better decisions. Knowing what has happened, what is happening, what needs attention, and what needs to be done is crucial.
B2B Reports help you create sales and marketing performance monitoring hubs, identify winning and losing campaigns, share success data with managers, colleagues, and investors and overall directly connect every part of your sales and marketing efforts to revenue.
What makes a Report a Good B2B Report? What should they consist of?
There are a lot of prerequisites for an effective and actionable B2B report. To make it easier and faster for you to grasp we’ve broken those down into the following sections:
Performance
Under this section, there are indicators of every components’ performance in a given period. These can be represented in the form of visuals and infographics to make them even more concise yet retain the required and necessary information.
Sales
This section will include the total sales figures for that particular time and additional information such as sales figures for every product or service.
Marketing
This section will include all information about the performance of various marketing campaigns running during that span and additional insights into how the market has changed in the period and how well is the marketing being received.
Production
Information regarding how many products were manufactured, projects completed, service cycles completed are reported under this section. Additionally, information regarding inventory level and resupply orders are reported under this section.
Progress
This section contains information regarding what progress has been made in various forms and functions of the business in comparison to the previous reporting cycle. This information is crucial as it helps one understand whether the business strategies are driving growth or need to be reworked to initiate and sustain growth.
Revenue Growth
A business’s growth is measured by comparing its revenue to that of the previous cycle. Revenue growth is generally accepted to be a good indicator of a business’s progress.
Customer Base Growth
This keeps a track of how many new customers were acquired, how many were retained successfully, and how many were lost to competition. Sustained positive growth in terms of Customer Base is highly sought after in B2B.
Costs and Expenditure
It is a general understanding that businesses keep becoming cost-efficient as they grow. Reporting on all costs and expenditures incurred while operating and monitoring them enables one to cut down costs wherever possible and increase efficiency.
What Went Right
The various positives such as target completion and objective fulfillment in various business processes are reported here which helps the firm understand what strategy brings good results. New objectives and targets can be set accordingly to ensure steady growth for the long term.
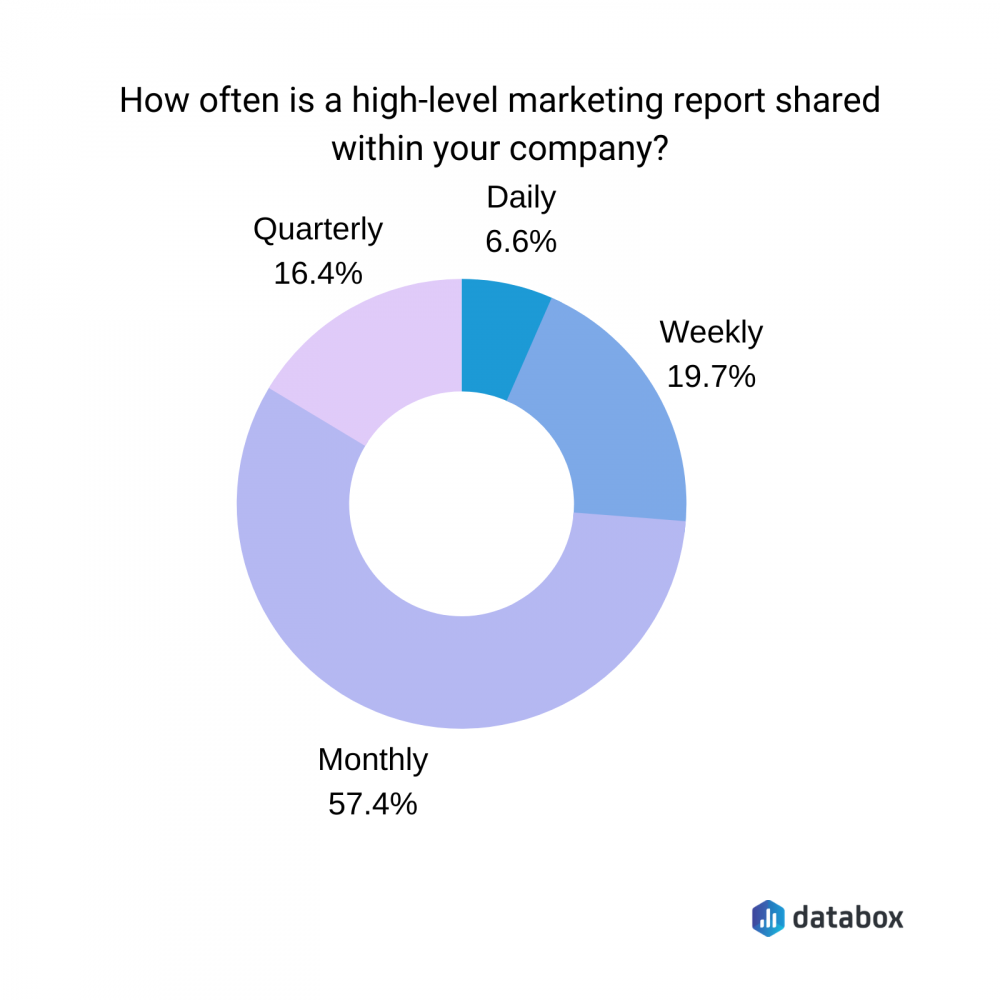
Image Courtesy – Databox
What Can Be Improved
This section reports the problem areas, those that need attention, and those that can be improved further on. Knowing where a function falls short in terms of either strategy or functioning helps the firm rework things to correct the performance and get it to a level which it is supposed to be at.
Essential KPIs for Your B2B Report
Key Performance Indicators help you make the reporting concise yet informative. A single number or a ratio can tell a lot about how the various functions of a B2B business are performing and this makes reporting and acting on the reporting effective.
We’ve categorized the KPIs below so it is easy for you to keep track.
Marketing KPIs:
1. Website Traffic
Though one of the basic KPIs, website traffic is a good base indicator of the effectiveness of your marketing function. The more traffic you have, the more sales you make (provided the traffic is relevant).
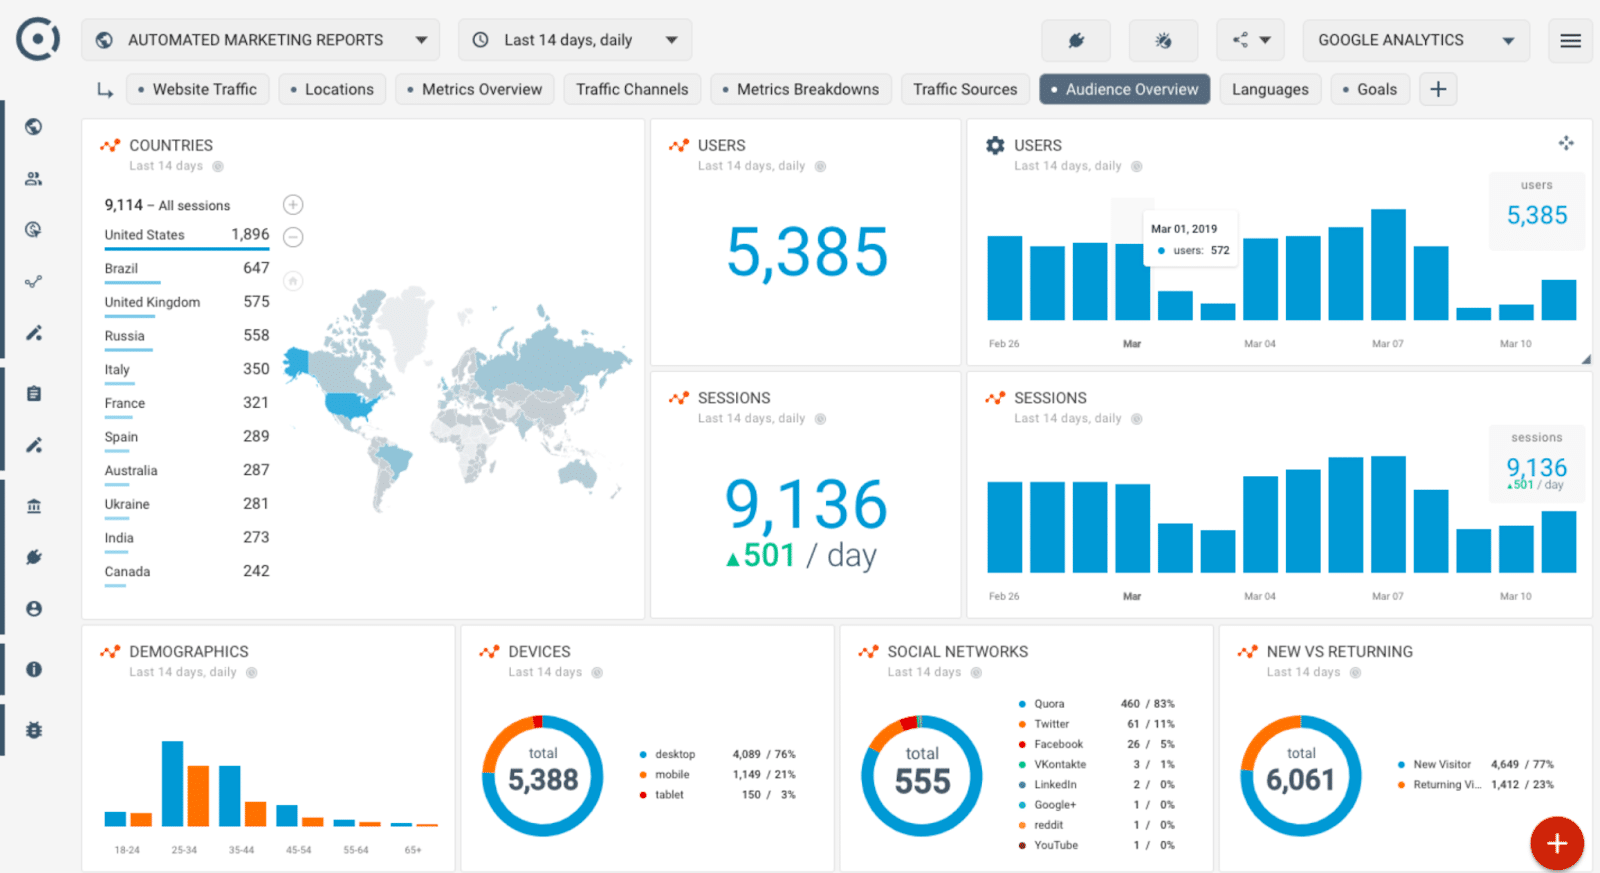
Image Courtesy – Octoboard.com
2. Conversion per Activity
Filtering out leads from the sea of visitors to your websites is essential. This metric helps you do this as visitors turn into leads and move down the sales funnel.
3. Customer Acquisition Cost (CAC)
Knowing how much it costs to acquire new customers reveals a lot about the effectiveness and efficiency of the marketing function. CAC is the average cost of acquiring customers.
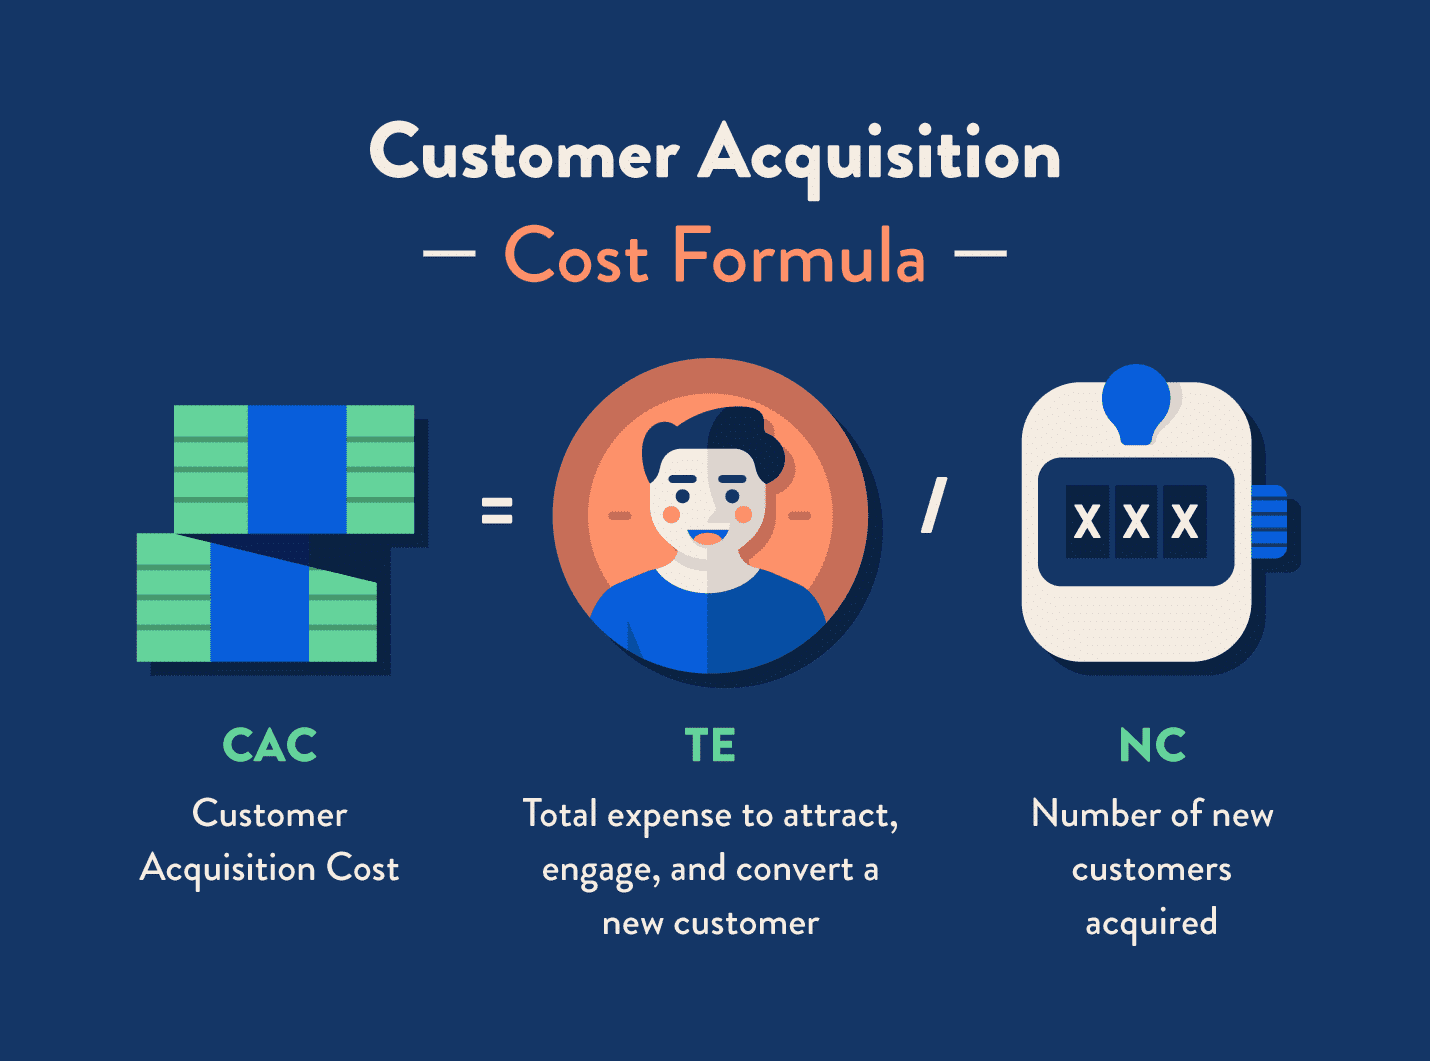
Image Courtesy – clevertap.com
4. Customer Lifetime Value (LTV)
Knowing how much revenue one customer adds to your business, in the long run, is important as it allows you to decide many things along with how much spending is justified to acquire new customers. If your customers stay subscribed for 10 months on average and spend $10,000 a month, the LTV is $100k per customer.
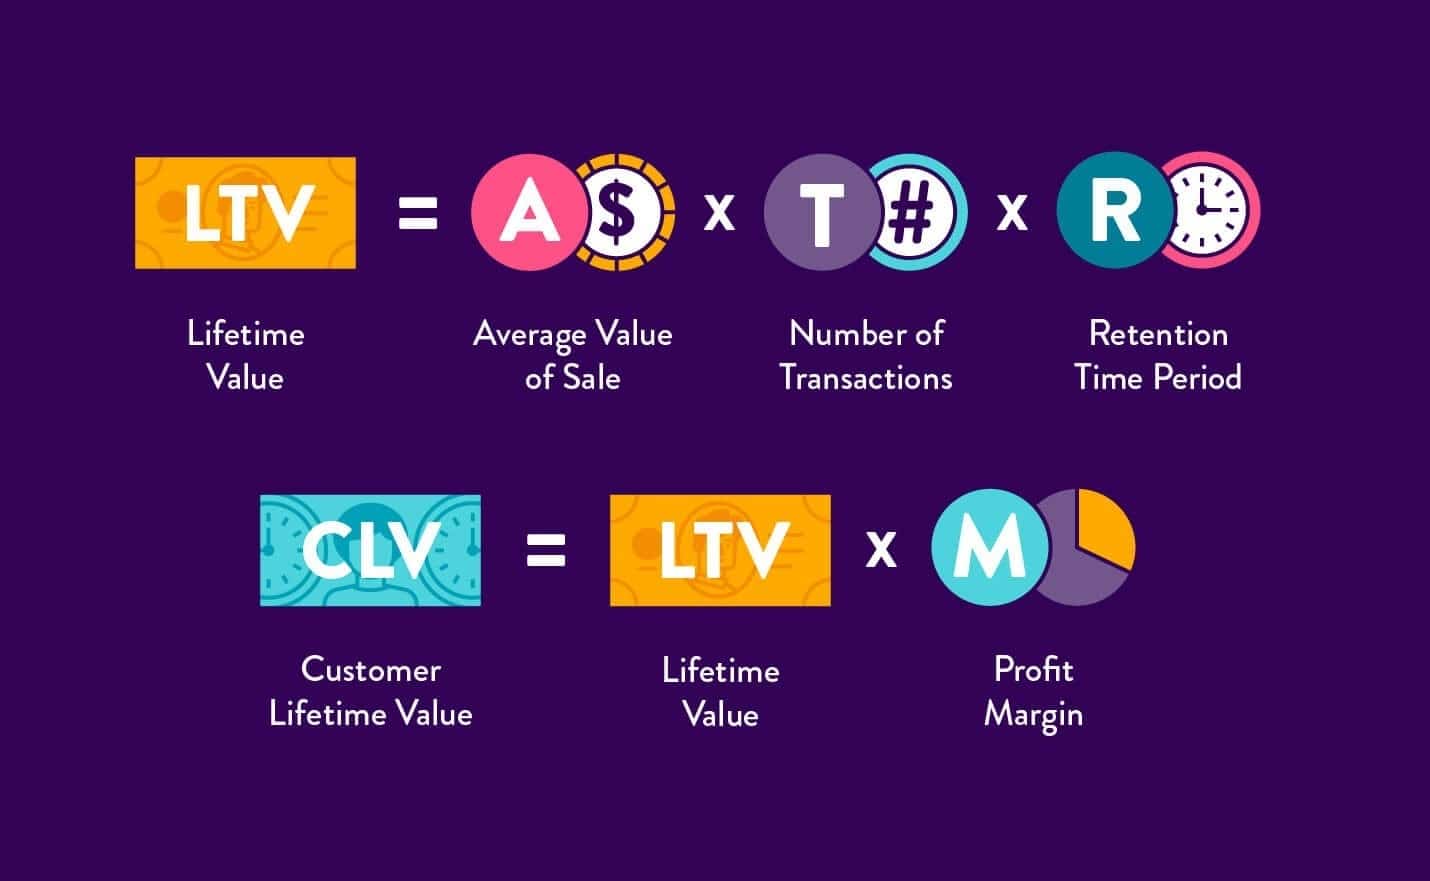
Image Courtesy – clevertap.com
5. Lead-to-Sale Conversion Ratio
Generating leads is not enough, knowing what percent of those convert into a sale, gives one a brief idea about what improvements are needed and what areas can be improved upon.
Sales KPIs:
1. Sales Velocity
It is a measure of how fast leads move through a firm’s sales funnel while generating revenue. Knowing and improving your sales velocity can help you sell faster and better.
2. Sales by Product or Product Type
A good indicator to understand which products and product lines are doing well and which products need upgrades and revamps to make them better.
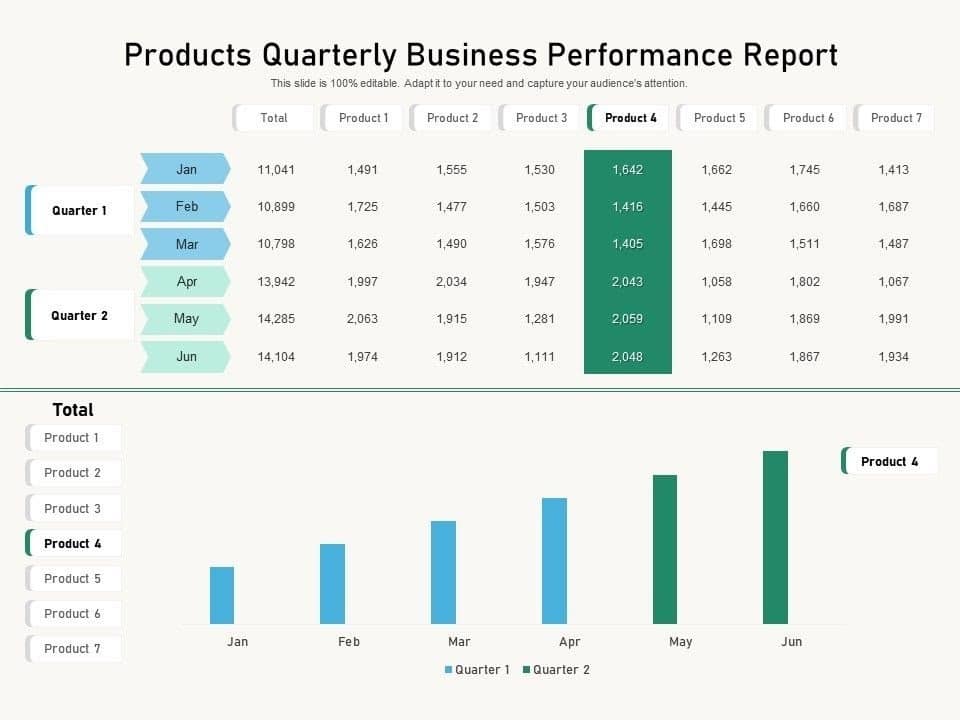
Image Courtesy – slideteam.net
3. Sales by Region
Helps one understand which region is doing well and which isn’t. This will facilitate a business to expand in regions with low sales and offer better service in regions that exhibit high sales volumes.
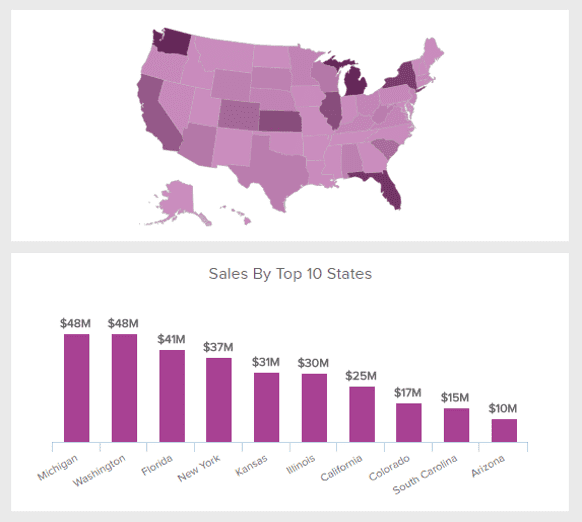
Image Courtesy – datapine.com
4. Opportunity by Lead Source
This indicator will point towards the source where most of your leads and revenue originate from. These sources can then be prioritized and invested more into.
5. MQl to SQL Conversion Rate
Knowing how many of the MQLs were converted to SQLs helps one understand the coordination between and cohesive function of sales and marketing functions.
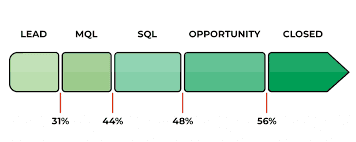
Image Courtesy- firstpagesage.com
Other Essential KPIs
1. Return on Investment
This is one of the most important KPIs for a B2B Business as knowing how much dollar output is generated for every dollar of input shows how well or how poorly the business is doing as a whole.
2. Monthly Recurring Revenue
This is a good indicator for knowing how many customers keep reordering your products or stay subscribed to your service. This reflects the demand for the value you’re providing to customers over time.
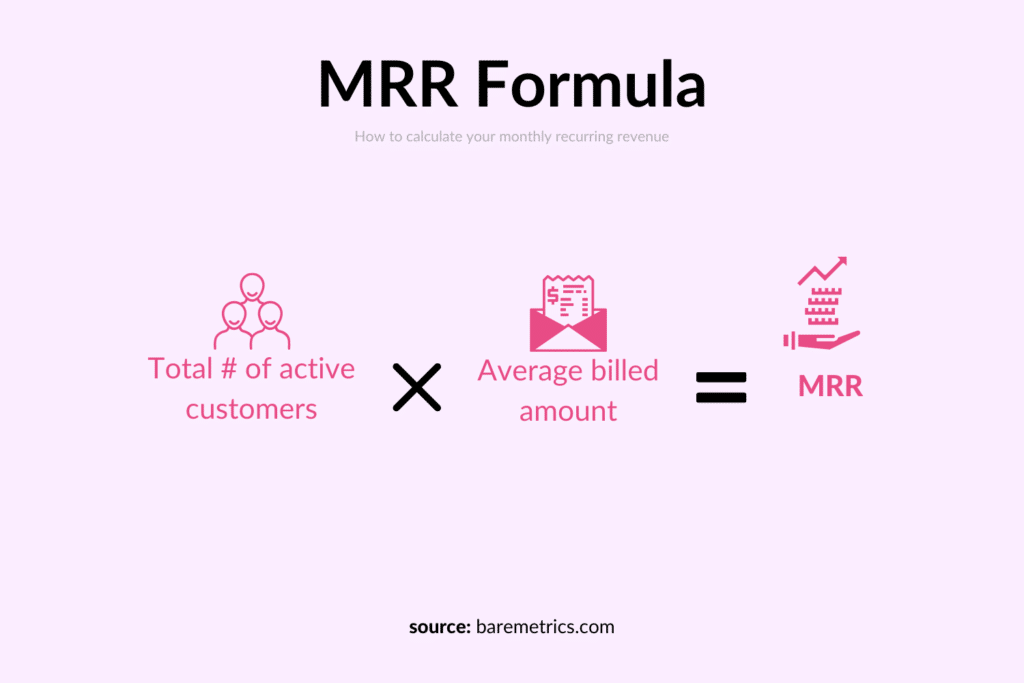
Image Courtesy -baremetrics.com
3. Customer Satisfaction
This indicator helps address any issues regarding customer satisfaction. Ensuring all your customers are satisfied goes a long way in ensuring growth for your B2B business.
4. Churn Rate
This indicator tracks how many good prospects and existing customers were lost over a period and can help address major issues as they arise to ensure quick mitigation to prevent further damage.
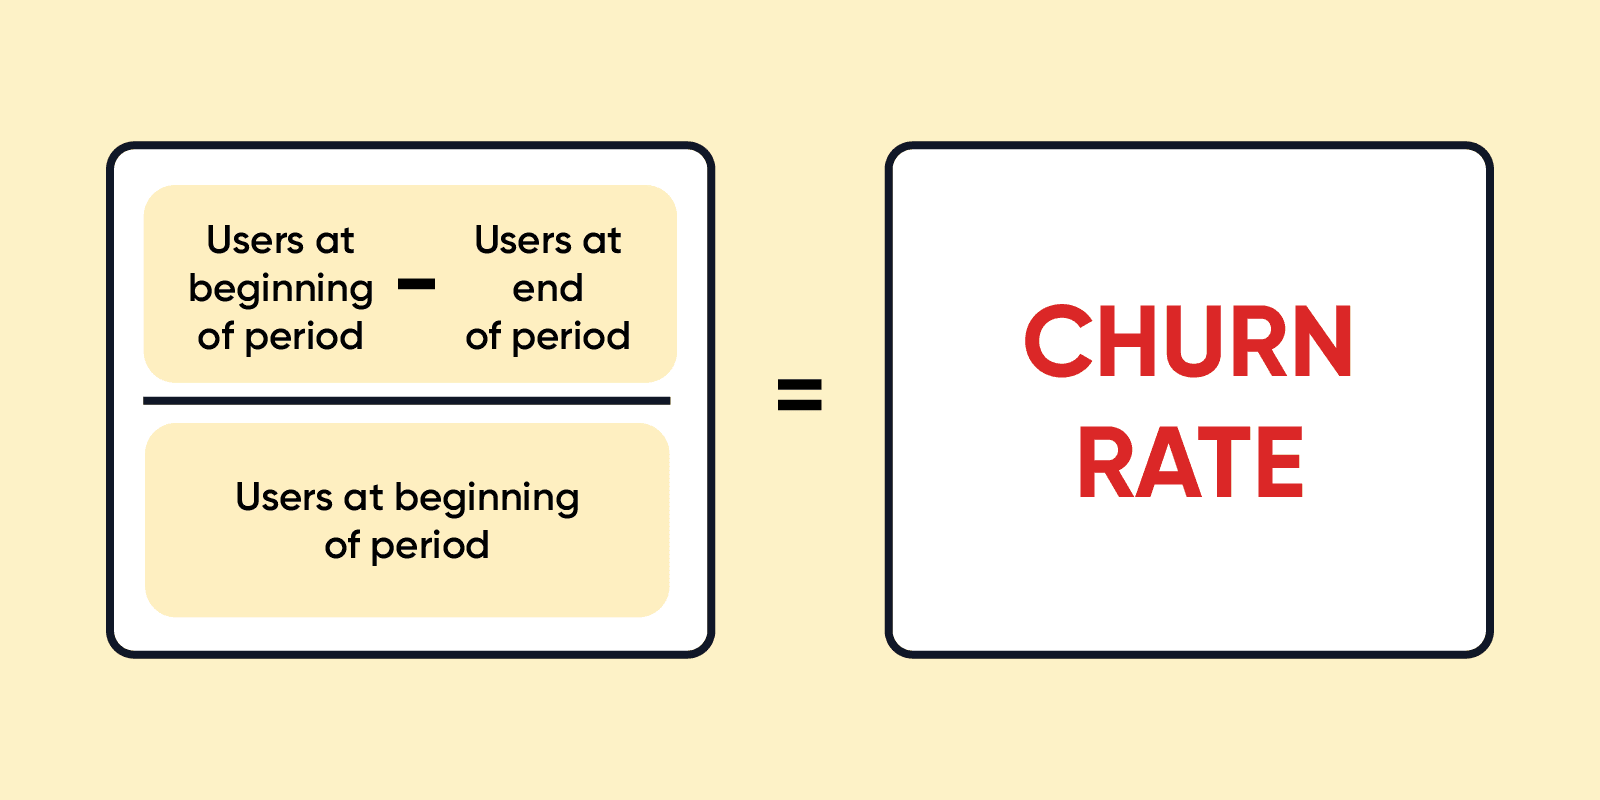
Image Courtesy – clevertap.com
5. Net Dollar Retention –
This indicator accounts for changes in monthly recurring revenue by factoring in the fluctuation in the size of the customer base over a set period.
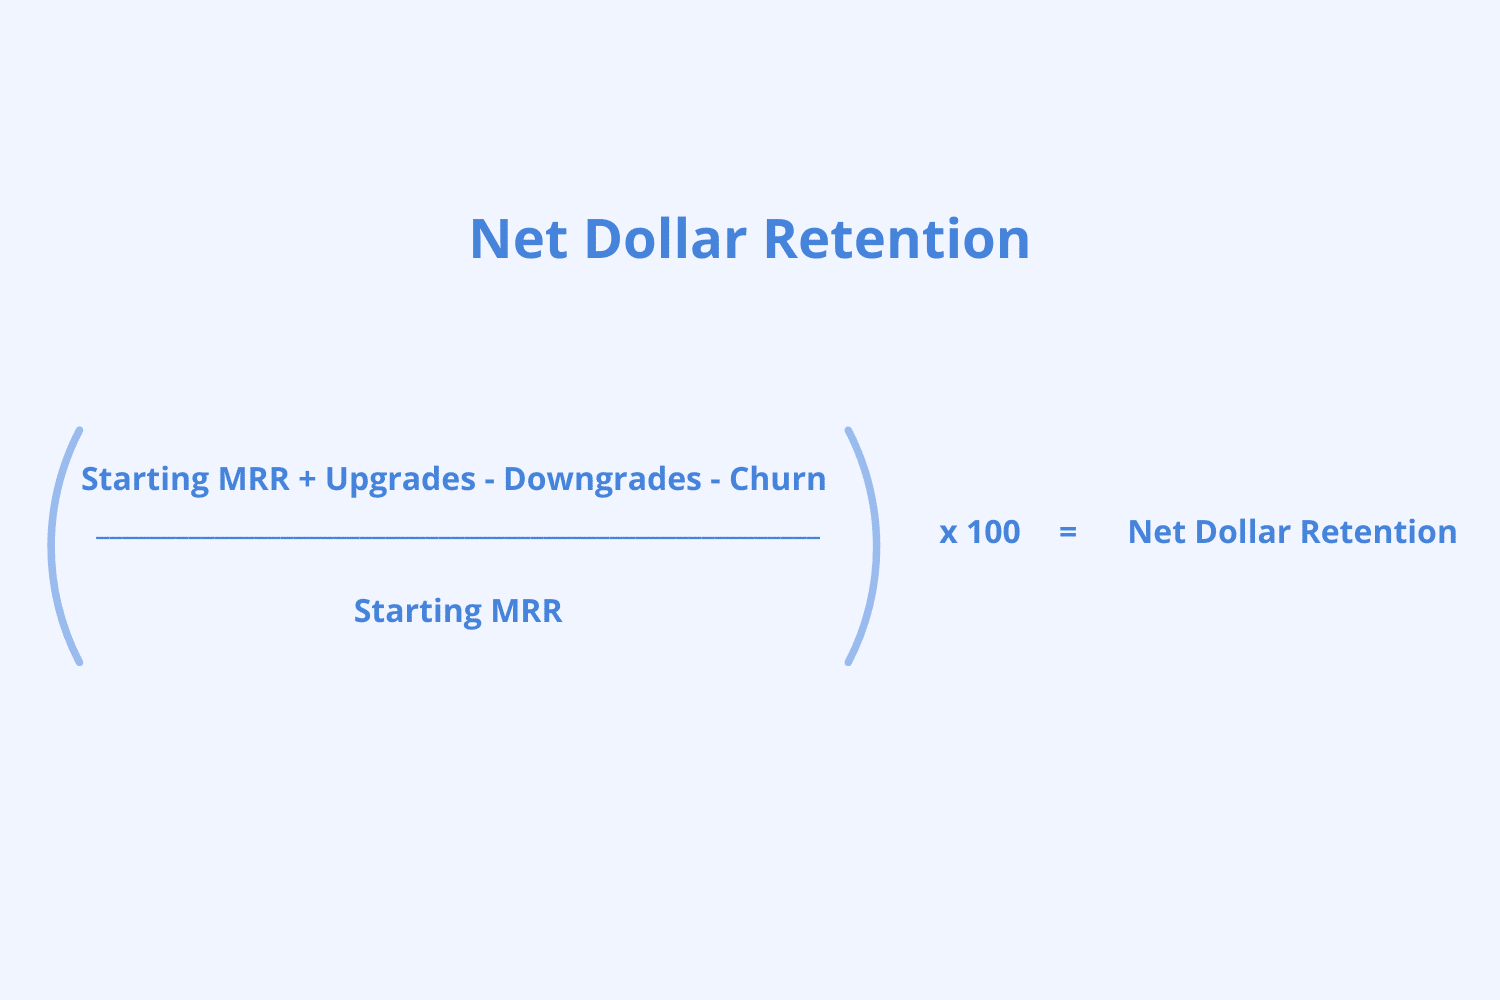
Image Courtesy – baremetrics.com
B2B Reporting: Do’s and Don’ts
Data is the foundation, but storytelling is the key. When you create reports, it is important for your team/supervisors to understand the message you want to send through these reports. To craft B2B reports that truly resonate and drive action, let’s explore what works and what doesn’t.
Do’s
Command Clarity
Clarity isn’t just a virtue in reporting; it’s a mandate. A muddled message is a missed opportunity. Structure your narrative with the ironclad logic of a seasoned general.
Employ language as sharp as a scalpel, and let visuals be your strategic allies. When clarity reigns, confusion surrenders.
Master Data Segmentation
Dissect your data into meaningful segments. Industry verticals, geographic landscapes, and business sizes are your starting points. Uncover hidden gems that aggregate data conceals.
Remember, segments are living entities, not static constructs. Evolve your segmentation strategy as your business and market evolve.
Harness the Power of Advanced Analytics
Advanced analytics is your magnifying glass, revealing hidden patterns and correlations. Traditional methods are like looking through a keyhole; advanced analytics open wide the doors of discovery. Discover untapped opportunities and address concerns with precision.
Don’ts
Ditch the Data Dump
Every data point should have a purpose. Ask yourself: “Does this move the needle?” If not, exile it to the appendix or the digital bin. Prioritize your metrics, ensuring they take center stage. And remember, data is a storyteller. Build a compelling narrative that guides your audience through your findings.
Eliminate Bias
Bias is the enemy of accurate insights. Transparency is your shield. Clearly outline your data collection and analysis methods. Diversify your data sources to avoid tunnel vision. Regularly audit your work for hidden biases.
And finally, invite an outsider to challenge your assumptions. A bias-free report is the cornerstone of sound decision-making.
Forgetting the Big Picture
While specific information is important, it’s equally crucial to understand how it fits into the big picture. Make sure your reports show how different parts of the business work together to achieve the company’s objectives. People want to see how the pieces connect, not just a bunch of isolated numbers.
B2B Reporting Software
You will find several B2B reporting products in the market. Tools like Hubspot Marketing Hub, Zoho Marketing Automation, and Salespanel Reports can provide you much of the data. Since we are Salespanel, we will explain how B2B reporting works on our tool.
Salespanel’s reporting will enable you to optimize various functional areas of your business to raise the level of revenue while minimizing the various necessary costs incurred during operations.
Reports are a good way of helping the various functions and personnel running a business understand what is going on with the business during a certain period.
Knowing what is happening within each function and the business as a whole enables the personnel and functions to adapt accordingly to ensure seamless operation and timely delivery of value to suffice the market demand.
The difficulty in making this possible is that personnel at different levels in the business need to be informed about different things for reporting to be effective.
The top-level executives require information that gives them a general overview of business functions and the business as a whole which enables them to understand and make decisions and implement decisions quickly.
The custom reporting function baked within Salespanel’s reporting enables you to generate relevant reports and distribute them to the right personnel and executives at the right levels.
This ensures that your managers, partners, investors, and fellow colleagues in other departments are aware of the important things.
To Wrap It Up
Reporting is an important business function that is usually not paid much attention to (by startups and smaller companies) but needs to be managed properly. It can bring a lot of benefits to a business’s internal functioning.
B2B businesses especially make big gains when their reporting function is working the way it is intended to. Having access to critical information at the right times promotes informed decision making.
If a B2B business wants to perform well and grow steadily it must have the right setup to ensure people running the business are informed about all necessary things at the right time. This ensures all the cogs keep turning and the business keeps running well.
Sell more, understand your customers’ journey for free!
Sales and Marketing teams spend millions of dollars to bring visitors to your website. But do you track your customer’s journey? Do you know who buys and why?
Around 8% of your website traffic will sign up on your lead forms. What happens to the other 92% of your traffic? Can you identify your visiting accounts? Can you engage and retarget your qualified visitors even if they are not identified?