Technographics: A Practical B2B Guide
What Are Technographics? (And What You’ll Be Able to Do With Them)
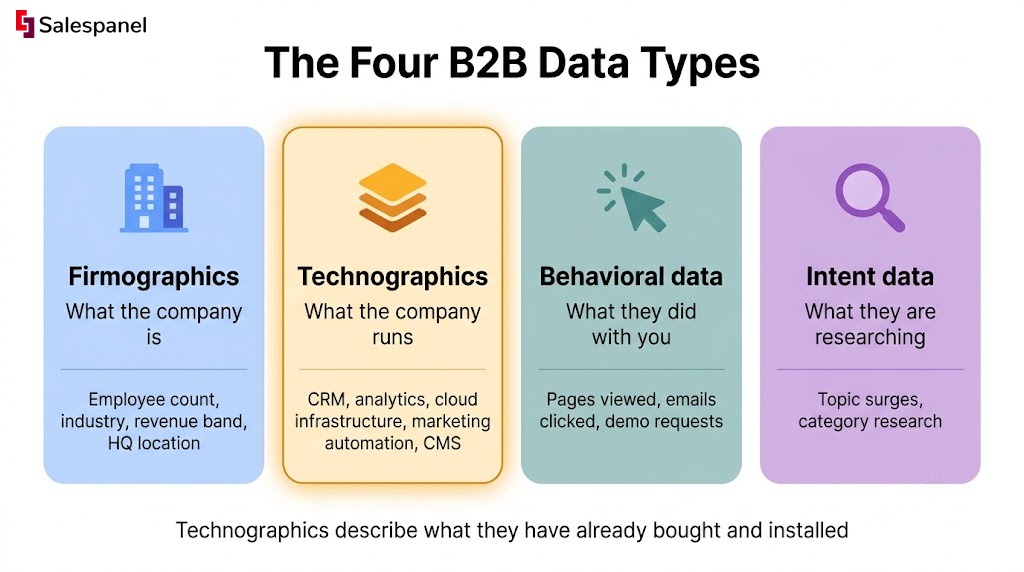
Technographics are data points describing the technologies an organization uses — its CRM, CMS, analytics platform, cloud provider, marketing automation suite, support desk, and so on. Firmographics describe what a company is. Demographics describe who a person is. Behavioral data describes what someone did on your properties, and intent data describes what topics they are researching elsewhere. Technographics describe what they have already bought and installed.
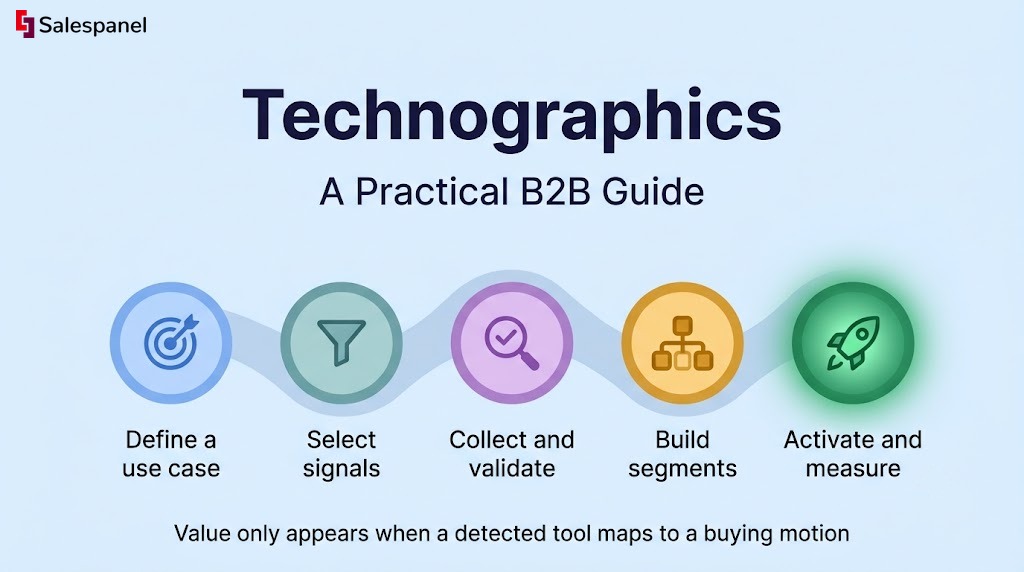
I would like to talk about what you can actually do with that, because the definition is the easy part. By the end of this guide you should be able to pick technology signals that are worth collecting, judge whether a given detection is reliable enough to act on, build segments that combine a stack signal with fit and engagement, and route those accounts to the right campaign or the right rep. The workflow underneath is simple and sequential: define a use case → select signals → collect and validate → build segments → activate and measure.
Now, a technology list on its own is close to useless. If you export every account that has a HubSpot tracking script on its website, you have a spreadsheet, not a go-to-market motion. Value only appears when a detected tool maps to a buying motion — a migration pain, an integration requirement, a budget owner, a competitive gap. That is the key idea, and most teams skip straight past it to the vendor demo.
| Data type | What it tells you | Examples |
|---|---|---|
| Firmographics | What the company is | Employee count, industry, revenue band, HQ location |
| Technographics | What the company runs | CRM, analytics, cloud infrastructure, ecommerce platform, marketing automation, CMS |
| Behavioral data | What they did with you | Pages viewed, emails clicked, product actions, demo requests |
| Intent data | What they are researching | Topic surges, category research on third-party publisher networks |
Technographics mix with the other three. A competitor’s logo in an account’s stack means very little by itself; the same signal on an account that matches your ICP and just read your comparison page is a different conversation entirely. If you want the broader picture of how these fields get appended to account records in the first place, our B2B data enrichment guide covers the plumbing. For hands-on inspection of a single domain, BuiltWith’s technology lookup is the fastest place to start.
Why Technographics Matter in B2B Go-to-Market
Technographics matter in exactly one situation: when the software a company already runs changes its pain points, its integration requirements, who owns the budget, or how likely it is to switch. Outside that situation, you are collecting trivia.
Three use cases carry most of the weight.
Competitive displacement. You identify accounts running a competing or adjacent product and build a motion around switching costs, missing capabilities, and migration effort. This is the most common use and the one teams most often ruin, because a competitor’s installed base includes very happy customers on three-year contracts.
Integration-led targeting. You prioritize companies already running the systems your product connects to. If your data product writes to Snowflake and reads from Salesforce, an account running both is cheaper to onboard and faster to prove value in. The sales conversation starts further along.
Message relevance. You change the landing page, ad creative, email angle, or talk track based on the stack. A RevOps tool selling into a HubSpot shop is selling something different from the same tool selling into a Salesforce shop — different admin, different object model, different implementation questions, different person in the room when the deal gets decided. Splitting those two audiences and writing two sets of copy is usually the highest-return technographic play a small team can run.
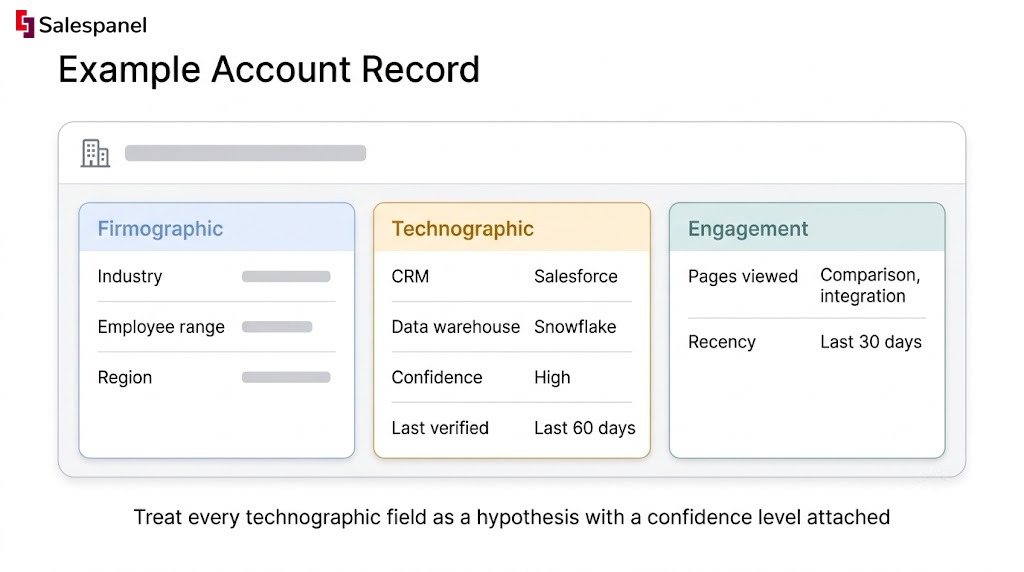
Of course, none of this proves anything about intent. A detected technology tells you what is installed. It does not tell you that the contract is expiring, that the budget exists, that anyone internally is unhappy, or that the tool is even actively used. Wappalyzer’s own documentation describes its data as technology detection from public web sources, which is the right framing — detection, not confirmation. Treat every technographic field as a hypothesis with a confidence level attached.
If you are already running account tiers, technographics usually slot in as a modifier rather than a primary filter. Our guide on account-based marketing segmentation covers where that modifier sits.
Step 1: Start With a Decision, Not a Data Vendor
Pick the technographic fields only after you have named the decision they will change. Account prioritization, paid audience creation, lead routing, outbound sequencing — one of those, specifically, written down before anyone opens a pricing page on a data provider.
The “collect everything” instinct feels safe and produces noisy segments nobody owns. A database with 4,000 detected technologies per domain gives your ops team 4,000 fields to normalize and your marketers no reason to pick one over another. Six months later the data exists, the segments are stale, and no one can say which technology signal ever changed a decision.
A one-page worksheet is enough to prevent this:
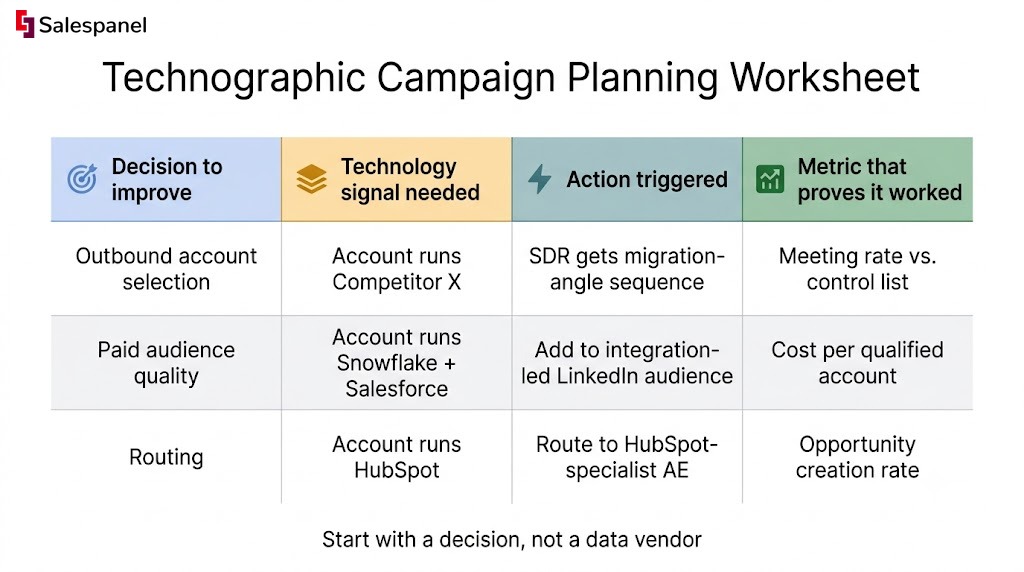
| Decision to improve | Technology signal needed | Action triggered | Metric that proves it worked |
|---|---|---|---|
| Outbound account selection | Account runs Competitor X | SDR gets migration-angle sequence | Meeting rate vs. control list |
| Paid audience quality | Account runs Snowflake + Salesforce | Add to integration-led LinkedIn audience | Cost per qualified account |
| Routing | Account runs HubSpot | Route to HubSpot-specialist AE | Opportunity creation rate |
1. Define the commercial motion
There are four motions, and they demand different signals. Sell-to means targeting companies running a compatible system — you need them on that platform for your product to work at all. Sell-with means targeting a partner ecosystem, where the partner’s install base is your qualified pool. Sell-against means going after a competitor’s installed base. Sell-around means finding a gap in an otherwise mature stack — an account running GA4, a tag manager, and a marketing automation platform, but nothing that identifies which companies are on the site.
That last one is worth sitting with, because gaps are harder to detect than presence and usually more commercially interesting. The absence of a category in an otherwise sophisticated stack says something about maturity and budget that the presence of a CDN never will.
Watch out for category-level signals that sound like targeting but are not. “Uses marketing software” matches almost every B2B company with a website. Require either a named technology or a category you have defined tightly enough to write different copy for.
2. Choose one measurable outcome
One primary metric per pilot. Qualified-account rate, meeting rate, opportunity creation rate, pipeline influenced, or conversion rate by segment — pick the one closest to the decision you named, and resist the urge to track five.
Before launch, record a baseline from a comparable period and a comparable non-technographic audience. If you cannot describe what “normal” looks like for that channel and that ICP slice, you will not be able to say afterwards whether the technology signal did anything. Teams skip this constantly and then argue about results for a quarter.
If the decision you picked is prioritization, the scoring mechanics in how to build a B2B lead scoring model will tell you where the technographic weight should sit.
Step 2: Select Technographic Signals That Are Actionable
The strongest technographic signals are specific enough to change a message or a workflow and reliable enough to trust at the account level. Both conditions, not one.
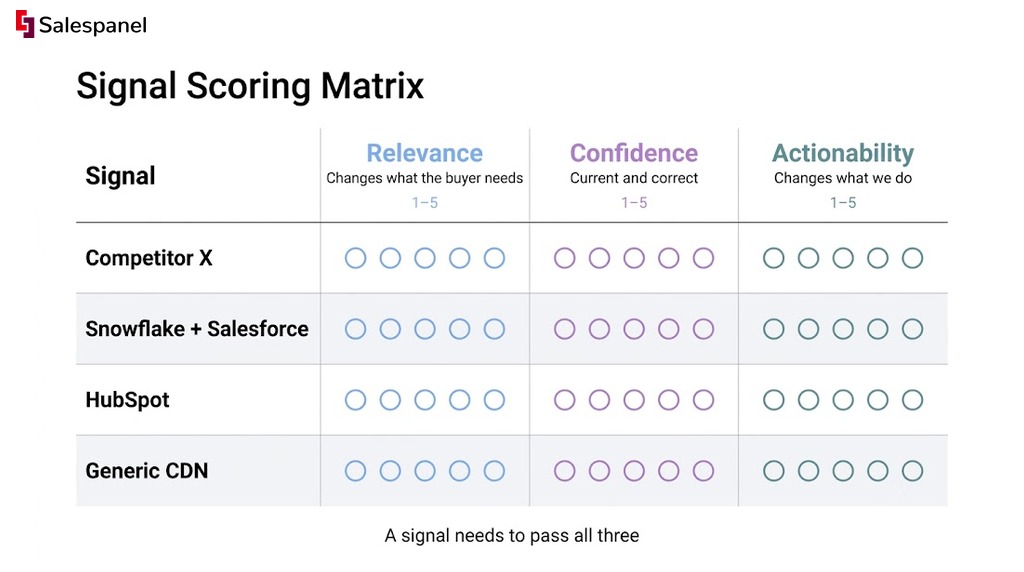
Most guides stop at “pick relevant technologies.” Here is a three-part assessment that holds up better in practice:
- Relevance: Does this technology change what the buyer is likely to need, ask, or object to?
- Confidence: How likely is this detection to be current and correct for the entity you care about?
- Actionability: Can marketing or sales genuinely do something different because of it?
A signal needs to pass all three. Plenty of technologies are highly relevant and badly detected. Plenty are reliably detected and commercially meaningless.
1. Prioritize technologies by buying relevance
Group detections into categories before you rank anything: CRM, marketing automation, web analytics, data warehouse, customer support, ecommerce, cloud infrastructure, CMS, sales engagement. Nine buckets cover most B2B stacks.
Then prioritize the categories nearest to the problem your product solves. A visitor identification product cares about analytics, CRM, and marketing automation. It does not care which font library the site loads. If your segmentation logic treats both with equal weight, the logic is wrong.
One structural limitation worth knowing. Client-side detection sees what the browser loads — tags, pixels, scripts, front-end frameworks, CMS fingerprints. It does not see the data warehouse, the ERP, the HRIS, or anything running server-side behind a login. If the technology that matters to you is a back-office system, website detection will not find it, and you will need third-party account data, enrichment, direct qualification on calls, or a CRM field your reps fill in. Teams discover this after signing the contract more often than before.
2. Set confidence rules before using the data
Detection errors are not rare edge cases. They are the normal operating condition, and they come from a handful of recurring sources:
- A JavaScript tag stays on the site for months after the tool was retired. Nobody removes dead tags.
- The parent company, a subsidiary, a regional site, and the agency-built microsite all run different stacks. Your detection hit one of them.
- The technology genuinely exists on a public page but belongs to the web team, not the buying team you want to reach.
- The record is simply old, and the provider has not re-crawled that domain recently.
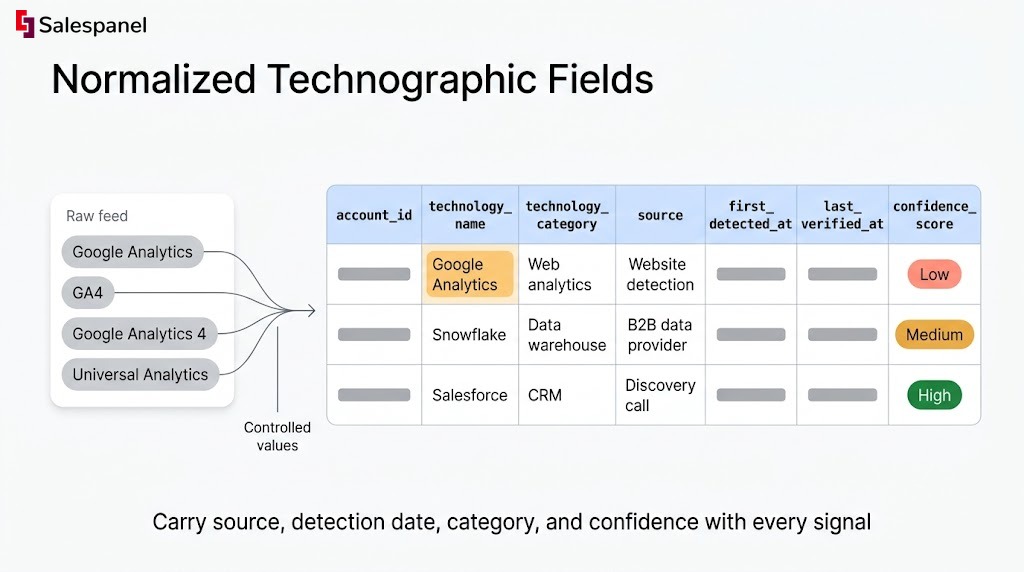
Carry four fields with every signal: source, detection date, technology category, and a confidence level. Those four fields are what let you say “high-confidence Salesforce detections from the last 60 days” instead of “accounts that use Salesforce,” and the difference shows up in reply rates on outbound.
Before you point a high-stakes audience or an SDR sequence at a segment, pull a manual sample. Twenty to fifty accounts, checked by hand, is usually enough to see whether the false-positive rate is 2% or 30%. That exercise takes an afternoon and has saved more campaigns than any provider comparison chart.
3. Avoid weak proxy signals
A generic CDN, a tag manager, a font library, a consent banner, a general-purpose analytics pixel — these are nearly universal and tell you almost nothing on their own. Cloudflare on a domain is not a buying signal. It is weather.
The discipline that fixes this: write a documented hypothesis for every signal you keep, in one sentence. If an account uses X, then message Y should outperform generic messaging because Z. If you cannot complete the “because Z” clause with something a customer has actually said, the signal is decoration. Retire it before it reaches a sequence.
For reference on what each tool can and cannot see, Wappalyzer’s documentation and BuiltWith’s resources both describe their detection methods in reasonable detail.
Step 3: Collect and Normalize Technographic Data
Reliable technographic programs combine a detection source with clean account matching, timestamps, and a documented way to resolve records that disagree. The detection source is the part everyone shops for. The other three are the part that determines whether the program survives contact with a real CRM.
There is a meaningful difference between website-detected data, declared data, enriched data, and CRM-sourced data. Website detection is fast, broad, and shallow. Declared data — what the prospect told your rep on a discovery call — is narrow, expensive, and the most trustworthy thing you will ever have. Enriched data from a provider sits in between and varies enormously by region and company size.
On that point: no provider is universally best. Coverage swings by geography, by company size band, by how much of the stack is publicly visible, and by technology category. A provider that is excellent for US mid-market SaaS may be thin on European manufacturers or on anything running behind a login.
1. Choose collection methods for the job
Practical options, roughly in order of breadth:
- Website technology detection — BuiltWith and Wappalyzer for public, client-side web technologies. Good for CMS, analytics, tag managers, ecommerce, front-end frameworks, chat widgets.
- B2B data providers — HG Insights, ZoomInfo, Demandbase, 6sense and similar for account-level enrichment across broader technology categories, subject to current coverage and your contract terms.
- Your own CRM and conversations — discovery call notes, implementation forms, onboarding questionnaires, win/loss research. The smallest dataset and the most accurate one.
- First-party website behavior — which known accounts engage with your integration pages, migration guides, or comparison content. Salespanel sits here, identifying the companies visiting your site and the pages they read, which is often the fastest way to find out that a technology signal actually matters to a real buyer.
Test any provider against a representative sample of your ICP before signing. Pull 100 accounts you know well, run them through a trial, and count how many come back correct, blank, or wrong. Category pages and coverage claims are marketing artifacts. Your sample is evidence.
2. Normalize names, categories, and account IDs
Raw technographic data arrives messy. A workable schema looks like this:
account_id
technology_name
technology_category
source
first_detected_at
last_verified_at
confidence_score
“Google Analytics,” “GA4,” “Google Analytics 4,” and “Universal Analytics” will all appear in your raw feed. They must resolve to controlled values before anything reports on them or automates off them, otherwise your segment of “accounts using Google Analytics” quietly excludes a third of the matches. The same applies to HubSpot (the CRM) versus HubSpot (the tracking code on a marketing site) — same vendor, different commercial meaning.
Domain-to-account mapping deserves written rules. Decide in advance how you handle parent companies with ten subsidiary domains, companies with separate .com and country domains, and acquired brands still running their own stack. The default behaviour of most enrichment pipelines — attach the detection to whatever domain it found — will create duplicate accounts and contradictory technology records inside a quarter.
3. Establish refresh and expiry rules
Set an expiry window per signal type rather than treating every record as permanent truth. The right window depends on how fast that category churns and how much damage a wrong call does.
A stale competitor detection is expensive: your SDR opens with “I see you’re using [Competitor]” to an account that migrated away eight months ago, and the credibility of the whole sequence is gone in one line. A stale CMS detection costs almost nothing, because nobody builds an opening line around a CMS. Tier your expiry rules accordingly — tight windows and re-verification for anything that drives outbound copy, looser ones for background segmentation fields.
More on the surrounding pipeline in our B2B account enrichment guide, and Salesforce’s data management documentation covers the hygiene side for teams normalizing inside the CRM.
Step 4: Turn Technographics Into Segments and Plays
A usable technographic segment pairs one technology condition with a clear audience definition and one specific next action. Anything missing a next action is a saved filter, and saved filters do not generate pipeline.
This step is where most programs either start working or quietly die, so the progression from raw filter to executable play is worth walking through carefully.
1. Build segments with more than one condition
The formula that works:
- Technology: uses a named CRM, competitor, or integration partner — at or above your confidence threshold
- Firmographic fit: target industry, employee range, region
- Engagement: visited a comparison, integration, or pricing page in the last 30 days
- Exclusions: existing customers, open opportunities, accounts in an active sequence, low-confidence detections
Technology alone gives you a big audience with no priority order inside it. If 11,000 companies in your market run Competitor X, that number is a market sizing input, not a target list. Layering fit narrows it to accounts worth winning. Layering engagement tells you which of those are in motion right now, and that ordering is what determines whether your SDRs work the top of the list or the middle of it.
2. Match the message to the stack
Message angles change by stack, and they should be written separately rather than templated with a merge field.
Competitor users respond to migration effort, a specific missing capability, or a side-by-side implementation comparison. Integration users respond to workflow continuity — what data flows where, what breaks, how long setup takes. Mature-stack accounts, the ones running eight tools in adjacent categories, respond to consolidation, governance, and reporting consistency, because their pain is coordination rather than capability.
Every play needs one evidence-based proof point sourced from your product team, customer research, or documented integration behaviour. A named migration timeline, a specific field mapping, a real customer’s before-and-after reporting setup. “Works with your stack” is not a proof point; it is a claim every competitor also makes, and buyers have learned to ignore it.
3. Route accounts based on fit and engagement
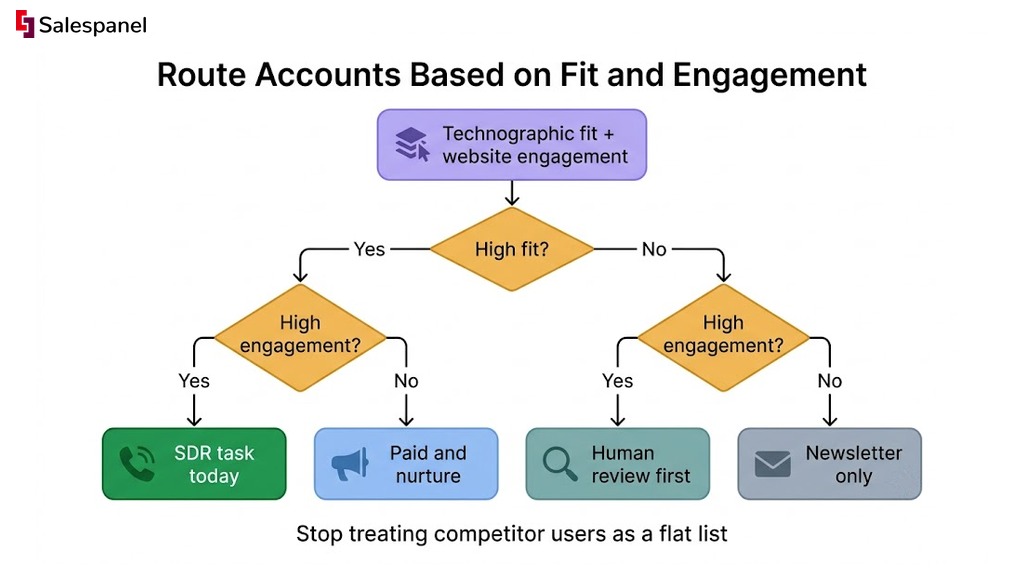
Two axes, four quadrants.
Fit score combines firmographics with technology relevance — does this account look like someone we can win, and does their stack make us a natural fit. Engagement score combines recency and depth of first-party activity — have they done anything on our site, and how recently.
High fit plus high engagement goes to an SDR today. High fit plus low engagement goes to paid and nurture until something moves. Low fit plus high engagement gets a human look before anyone spends on it, because that quadrant is where your ICP definition is wrong or your content is attracting the wrong crowd. Low fit plus low engagement gets nothing beyond the newsletter.
The engagement axis is the one teams struggle to populate, because most website traffic is anonymous. Salespanel helps here by identifying the companies behind website visits and feeding real-time page-level engagement into account scoring, which makes a technographic segment considerably more useful — you stop treating 11,000 competitor users as a flat list and start working the 40 of them who read your migration guide last week.
Related reading: visitor identification software and account scoring.
Step 5: Measure Whether Technographics Improve the Motion
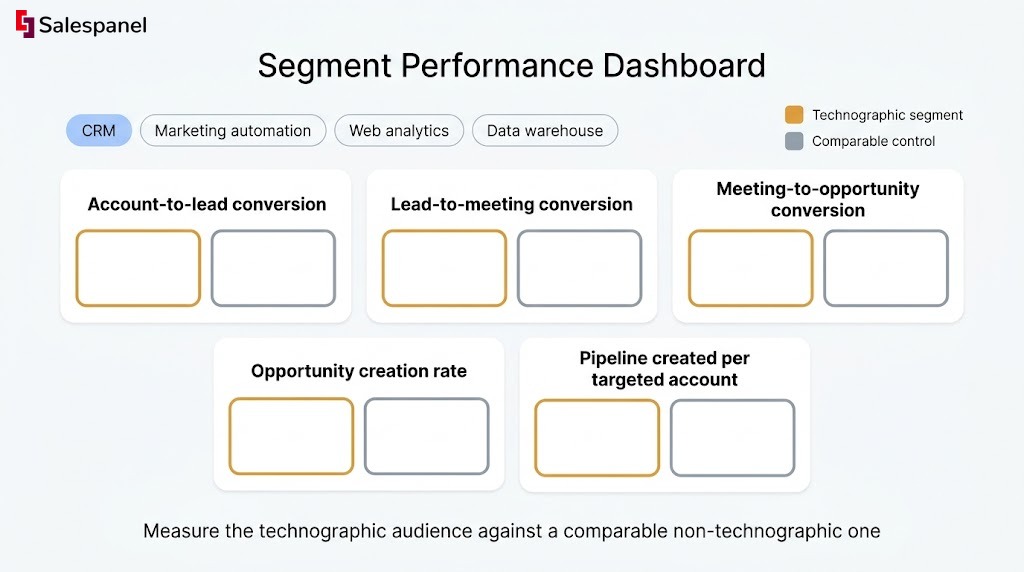
Measure the technographic audience against a comparable non-technographic one, or you will never know whether the signal did anything. Without a comparison, every result looks like proof — the segment converted, therefore the technology data worked, therefore buy more technology data.
Audience size and email open rate do not settle targeting questions. A technographic segment is supposed to be smaller, and open rate mostly measures your subject line and sender reputation. Neither number tells you whether the stack signal predicted anything about fit.
1. Set up a clean comparison
Match the two segments on industry, company size, channel, and campaign period. Same sender, same offer, same time window, same ICP slice. The only variable should be whether the technology condition was applied.
Metrics worth tracking:
- Account-to-lead conversion
- Lead-to-meeting conversion
- Meeting-to-opportunity conversion
- Opportunity creation rate
- Pipeline created per targeted account
Give the downstream metrics enough elapsed time. If your sales cycle runs 90 days, opportunity creation rate at day 30 is noise, and reading it as a result will lead you to kill a working segment or scale a broken one. Early on, lean on the top two conversion steps and treat anything further down as provisional.
2. Review signal quality monthly
Put a recurring 45-minute audit on the calendar and answer four questions with data in front of you:
- Which technologies correlated with qualified accounts?
- Which signals produced irrelevant outreach, based on reply content and rep feedback?
- Which technologies had coverage gaps across the target list?
- Which messages performed differently by stack?
Then act on it. Retire the segments that did not produce a measurable improvement after a fair test, even if the underlying data looks impressive on a slide. Sophisticated-looking segmentation that does not move conversion is overhead with a dashboard attached. The teams that get value from technographics are usually running three or four well-validated signals, not forty.
For the measurement framework around all of this, see our B2B marketing attribution guide.
Common Technographics Mistakes to Watch For
Most technographic failures trace back to two root causes: treating detected software as verified buying intent, or automating outreach before anyone validated the data. The four mistakes below are variations on those.
Mistake 1: Treating a website tag as a confirmed company-wide tool
A tag on a marketing site tells you something about that site. The parent company may run a different CRM than the subsidiary. The agency that built the microsite installed its own analytics. The retired tool’s script is still loading because no one cleaned up the tag manager.
Fix: store source and confidence with every record, and manually validate high-value accounts before a human or an ad touches them. For the top 50 accounts in a play, that check costs an hour.
Mistake 2: Buying data before defining a use case
A larger technology database does not resolve unclear segmentation or weak messaging. It gives you more fields to be unclear with, at a higher annual cost, and it tends to arrive with an expectation that someone will “use” it.
Fix: start with one motion, one to three technology signals, and one measurable outcome. Expand only after a signal has earned it.
Mistake 3: Sending identical outreach to every competitor user
A competitor’s installed base is not a homogeneous group of unhappy buyers. It contains genuinely satisfied customers, accounts two months into a three-year contract, teams mid-implementation, and companies at completely different maturity levels. Blasting all of them with the same displacement email trains the whole segment to ignore you.
Fix: layer the technographic condition with fit and engagement, and write at least two message variants by maturity or trigger.
Mistake 4: Ignoring privacy, contracts, and consent rules
Technographic collection and activation touch applicable privacy law, provider terms of use, consent requirements, retention limits, and regional restrictions — and the rules differ by jurisdiction and by how you obtained the data. Review your setup with your legal or privacy team before scaling, particularly for anything combining technographic data with identified individuals. The UK ICO’s guidance is a reasonable starting reference for UK/EU-facing programs.
A Simple 30-Day Technographics Pilot
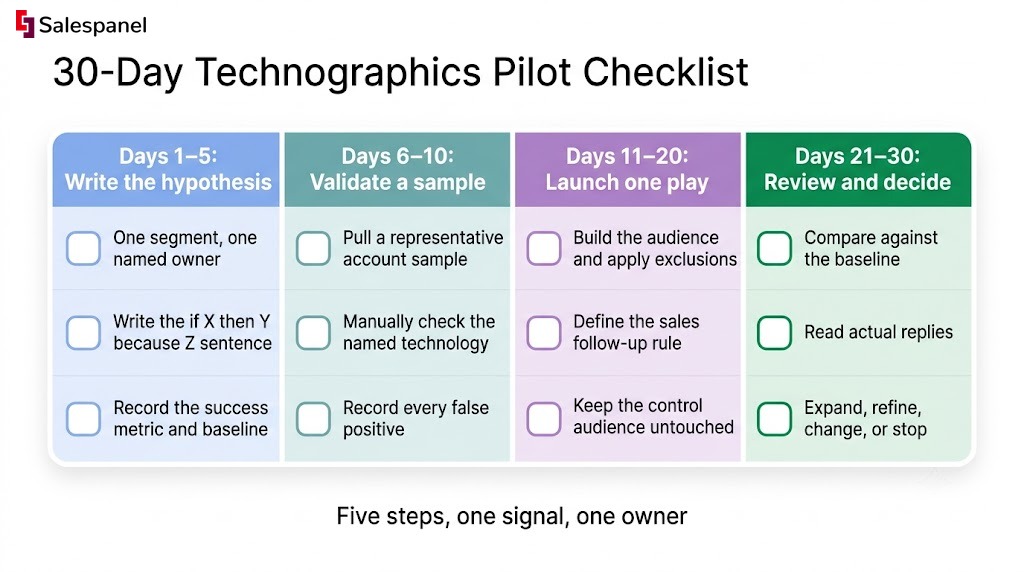
Thirty days is enough to validate data quality, operational readiness, and early-funnel signal before you commit to more technologies, more providers, or an annual contract. It is not enough to prove pipeline impact, and you should say so out loud before starting so nobody expects a revenue number at the end.
Days 1–5: Pick one use case and write the hypothesis
One segment. One named owner for the workflow. One sentence in the if X then Y because Z format. Write down the success metric and pull the baseline number from a comparable audience and period. Five days is generous for this; most of it goes to agreeing on the metric.
Days 6–10: Source and validate a sample
Collect a representative account sample — a few hundred accounts that look like your ICP, not your easiest matches. Manually check the named technology on as many as you reasonably can and record every false positive you find. That false-positive rate is the single most important number in the pilot, and it determines whether you proceed, change source, or stop.
Days 11–20: Launch one tailored play
Build the audience, apply the exclusions, produce the campaign asset, and define the sales follow-up rule before anything goes live. Keep the control audience or baseline untouched. Resist adding a second technology signal mid-flight, however tempting it gets around day 14.
Days 21–30: Review, decide, and document
Compare conversion and quality signals against the baseline, and read actual replies rather than only dashboards. Then make one of four calls: expand, refine the signal, change the message, or stop the play. Write the decision and the reasoning somewhere the next person will find it.
If the pilot outcome feeds your prioritization logic, how to score B2B leads covers where to put the weight.
FAQ
What does technographics mean?
Technographics are data points describing the technologies an organization uses, such as a CRM, CMS, analytics platform, cloud provider, or marketing automation tool. B2B teams use technographics to segment accounts, tailor messaging, identify integration opportunities, and prioritize outreach when a technology signal is relevant and recently verified.
Who are the top B2B technographic data providers?
Common B2B technographic data sources include BuiltWith and Wappalyzer for public website technology detection, plus providers such as HG Insights, ZoomInfo, Demandbase, and 6sense for broader account data products. The right provider depends on target-market coverage, technology categories, data freshness, geographic availability, and validation results from a representative account sample.
What does a tech marketer do?
A tech marketer plans and runs marketing for technology products or technology-focused audiences. Responsibilities can include defining segments, positioning products, creating campaigns, supporting product launches, measuring funnel conversion, and coordinating with sales and product teams. Technographic data can help a tech marketer adapt messaging to an account’s existing software stack.
The Social Technographics Ladder is a Forrester framework that groups people by how they participate online, using categories such as creators, critics, collectors, joiners, spectators, and inactive users. It is different from B2B technographics, which describes the software and technology systems used by an organization.
Next Step: Start With One Signal and One Workflow
Technographic programs that work are small, validated, and tied to a measurable action. The ones that fail are large, unvalidated, and tied to a dashboard.
The operating sequence is worth repeating because the order matters more than any individual step: define the decision, assess signal quality against relevance, confidence and actionability, normalize the data with sources and timestamps, activate one focused play, and compare it against a baseline you recorded before launch. Five steps, one signal, one owner.
Write the hypothesis before you add a data source or build an automation. That one sentence — if an account uses X, then message Y should outperform generic messaging because Z — is the cheapest quality filter available, and it will stop at least half of the signals you were about to buy.
For teams that want to prioritize known accounts by live website engagement alongside firmographic and technographic fit, Salespanel’s visitor intelligence platform identifies the companies on your site and scores them in real time, so your technographic segment becomes a ranked list of accounts actually in motion rather than a static export.
Sell more, understand your customers’ journey for free!
Sales and Marketing teams spend millions of dollars to bring visitors to your website. But do you track your customer’s journey? Do you know who buys and why?
Around 8% of your website traffic will sign up on your lead forms. What happens to the other 92% of your traffic? Can you identify your visiting accounts? Can you engage and retarget your qualified visitors even if they are not identified?