Decoding PPC Reporting: Tools, Metrics, and Best Practices
PPC or pay-per-click advertising is a vital lead and demand generation strategy. Whether you have just introduced your brand to the market, or you’re an established business seeking to expand your presence, PPC can be a powerful tool. Over 8.5 billion searches are conducted on the Google search engine alone in one day. Thus, if you are trying to increase your visibility online without the long strenuous process of ranking content organically, paid ads are the best way to get your brand in front of the right people at the right place and time.
But the thing about paid ads is that, well, it is paid. Knowing whether your money is actually being directed to the right initiatives to bring you desired results is much more important, and this is where PPC reporting comes in.
A PPC report is the performance review of your ad campaign, and it should be concise and comprehensive and must show you clearly what’s working for your PPC campaigns and which aspects need optimization for better outcomes. But it is often a mess of charts and analytical data thrown into a slide deck or annotated haphazardly on a spreadsheet—which frustrates you until you give up and run your ad campaigns based on your intuition or random advice you find on the internet.
Bad call—because you lose a lot of money on it. But PPC reporting doesn’t need to be such a big challenge!
Once you understand the data flow and learn to spot the patterns and trends within it, you can use PPC reporting to maximize the power of metrics and analytics to optimize your strategies and significantly impact your brand’s paid advertising strategies. It will also ensure that your time and resources are dedicated to generating measurable results for your company, such as a boost in sales and revenue.
In this blog, we will discuss what PPC reporting is, what goals and metrics you need to decide on before you create a campaign, the importance and challenges faced in PPC attribution by B2B businesses, and some industry-best tools you can use to do it right! Let’s get started!
What is PPC reporting?
PPC reporting is the act of drawing up a PPC report—a compilation of the latest data derived from your current pay-per-click (PPC) ad campaign, to determine its success. It is a marketing analysis report that details which KPIs are doing great and which need to be improved to generate better results.
PPC reporting helps you monitor the performance of your PPC campaign in relation to your unique business needs and goals. In addition, your report provides granular insights into your paid marketing strategies that can help you optimize your campaign to provide long-term outcomes favorable for business growth.
PPC reporting breaks down your paid ad campaigns into KPIs such as:
- Return on ad spend (ROAS)
- Cost per acquisition (CPA)
- Revenue generated
- Average cost per click (CPC)
- Average click-through rate (CTR)
…and more!
Your PPC reports are fully customizable to your ad campaigns and do not depend on the channel or type used. You can delve deeper into what is and isn’t working in your paid stack by having a channel-specific report for each paid channel.
Setting up goals before getting into PPC report generation
Getting into PPC report generation without first setting any goals or objectives to achieve is a mistake. But, we understand it may be overwhelming to decide which KPIs to track or what goals you want your paid marketing initiatives to achieve.
Unfortunately, there is no “one-size-fits-all” strategy for PPC reporting. You must consider many factors to determine which impacts your ad campaigns most. These include —
- Your ideal prospects,
- Your industry,
- The type of campaigns you want to report on, etc.
Whether you are working in a marketing agency or a business owner starting to push out ad campaigns, it will factor into your PPC reporting goals.
Some common PPC reporting goals are —
- Provide an overview or a comprehensive understanding through an executive report
- Show the ROI and ROAS gained by the particular campaign
- Showcase your work through detailed use cases
- Track the progress of your marketing initiatives for further optimization
- Decipher key industry trends to make more targeted campaigns
Your PPC campaign success can differ from your competitors or from one ad campaign to the next. Knowing what you expect from your PPC reports can help you determine the kind of report you require to show that.
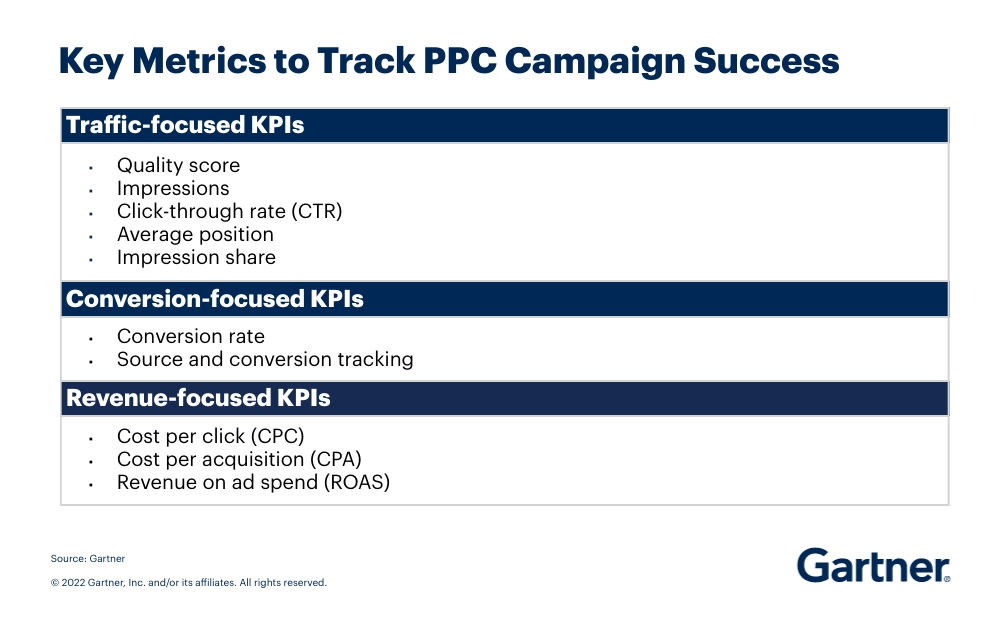
Image Source: Gartner
Key metrics to include in PPC reports
Here are nine key metrics you should include in your PPC reports:
1. Impressions
These are the views generated when someone comes across your paid ad, regardless of whether they clicked on it. You may have multiple impressions from the same person, usually free. It also indicates whether SERPs are ranking your ads higher or lower—low impressions mean your ad is probably appearing to them lower down on the page.
Impressions tell you that your brand awareness is increasing. However, if your impressions vs. click-through rate on your ad is low, it may mean that while people are viewing your ad, they are not inclined to click on it. This indicates that you must improve your copy or fine-tune your targeting to relevant audiences.
2. Click-through rate
This is the ratio of the number of clicks you generated to the number of impressions you were displayed for. It is shown as a percentage and varies between accounts and verticals. CTR generally indicates how well your ads generate interest amongst your target audience, enough for them to click on the ad and see what you are presenting.
A high CTR means you are on the right path to maximizing conversions for your brand. It also contributes to the quality score of your ad—that tells you how relevant your ad is in the current market conditions and whether your prospect appreciates the information you are providing them for their search needs.
3. Conversion Rate
This metric succeeds CTR in displaying (as a percentage) how many clicks led to conversions. Conversion rate tells you how many website visitors are impressed upon clicking through to your landing page or website and deciding to purchase from your brand.
Conversion rate is very important to a healthy ROI-driven paid advertising strategy since it clearly shows that the $$$ you are spending is being directed to generate sales and revenue for your brand. If your conversion rates are inconsistent with industry standards, you may need to evaluate your ads for copy, placement, keywords, targeting, and much more!
You can positively impact your conversion rates by improving your landing page copy, using powerful and eye-catching CTAs, changing your bidding strategy, and tracking more than just purchases (for instance, micro-conversions, like a user downloading an e-Book, etc.)
4. Cost Per Click (CPC)
Cost per click estimates how much a click from a viewer on your ad costs. It provides a financial average of all clicks from a particular keyword, ad, ad group, campaign, or other assets you may be analyzing. It is ideal to have a low CPC and a high CTR.
You can lower your cost per click by making ads more relevant to your target audience and positioning them right by bidding on low-competition but high-volume keywords. You can also lower CPC by favoring manual bidding instead of automated bidding—the latter will bid aggressively depending on your goals and disregard CPC. You can avoid that by limiting your bid cap on maximum clicks or reducing your targets for cost per acquisition (CPA) or return on ad spend (ROAS). You may also pause other low-value ads and focus all spend on an ad generating you high-value leads and conversions, even if it has a high CPC.
5. Cost Per Acquisition (CPA)
Cost per acquisition (CPA) or cost-per-lead (CPL) is the ratio that determines the total amount of money you spend on your ad to get the total number of paying customers buying products from your brand.
You can lower the cost per acquisition by detecting where you are spending your money the most. For example, you could be bidding on a competitive keyword costing you a lot, or your topic targeting for display can be optimized.
You can reduce CPA by lowering your target CPA to more realistic standards through manual bidding. Lastly, you can also directly lower your ad spend—less money spent on ads means you automatically spend less on acquiring customers. But this strategy is not advisable since customer acquisition is paramount to new businesses.
6. Average Cost Per View (CPV)
Cost per view (CPV) on display or video ad campaigns is especially useful to understand how much of your resources you spend to garner views on your ads. This metric averages how much each view on your ad costs you, and you can adjust for inflation if your CPV is high—by trying out CPV bidding or narrowing your target audience segment. Getting views from qualified leads can significantly impact the average CPV.
7. Average Cost Per Impression (CPM)
This metric averages your ad spend to gain every 1000 impressions. This is also specifically useful for high-volume video campaigns and is commonly leveraged in CPM bidding.
8. Conversion Value
This metric helps you understand the value of each lead you convert. Let’s understand this with an example.
Most companies offer different packages and create ad campaigns for each offer separately. Suppose your $100 offer ads aren’t converting as much, but your $20 offer ads are converting like crazy. This means, at the end of the day, if the number of sales on your low-balling offers is exponential compared to the sales from your high-value offers, you will achieve your desired revenue goals.
To improve your conversion value, map your customer’s journey on your website and evaluate your offers to see which elements attract more clicks. You can find additional actions to propel conversions and build your next ad campaign accordingly.
9. ROAS
Return on ad spend is a major metric for e-Commerce ad campaigns, but it has implications for ad campaigns from every industry. ROAS is the overall revenue you are generating from your ad campaigns. ROAS is shown as a ratio or percentage, and a healthy “ROAS should approximately be three times more than the budget of your ad campaigns,” as Adam Smartschan of Altitude Marketing emphasized.
To boost ROAS quickly, you must set a target ROAS for your campaign bidding strategy. Many e-Commerce platforms also offer Smart Shopping plans for ads geared towards increasing ROAS for your brand.
Importance of attribution in PPC reporting and the challenges faced by B2B businesses
Attribution is an essential part of PPC campaigns because it tells marketers whether the $$$ they are spending toward paid ad campaigns are creating a real impact in revenue generation. It also helps marketers understand which search or display ads are optimized for the target audience and structure future ad campaigns similarly.
But B2B advertisers face many challenges because search engines like Google limit KPI data from ad campaigns and introduce new updates that don’t suit PPC reporting for B2B companies.
The two main challenges faced by B2B marketers in paid marketing include the following:
B2B businesses often face significant challenges in PPC tracking, largely due to the focus of analytics on holistic data rather than individual actions. Unlike B2C businesses, B2B firms require detailed data on individual prospects to track and manage long customer journeys typically associated with high average contract value (ACV) accounts. Consequently, the standard analytics approach falls short, as it provides an aggregate view and not the granular insight B2B marketers need. The need to track individual interactions across extended sales cycles highlights the need for specialized solutions and strategies for B2B PPC tracking.
Tools like Salespanel or Hubspot Marketing Hub need to be used to track complex B2B customer journeys and connect them to PPC campaign data.
2. Overlapping search terms
Overlapping search terms mean there will be a high search volume for an industry-relevant keyword, and because of overlap, the CPC will be higher, thereby killing your B2B paid marketing budget. Here are some ways you can circumvent this problem —
- Using exact-match and phrase keywords: B2B advertisers can have more control over matching with the phrase and specific keywords, which is essential in the B2B market.
- Including industry-specific jargon to limit overlap and continue targeting an industry-specific keyword by talking with sales and customer service teams to identify what terms the prospects and customers use in their queries to narrow targeting
These tactics might reduce search volume and impressions, but the lead quality will be much higher.
3. Platform changes
The updates made to the Google search engine in recent years haven’t been exactly helpful for B2B marketers.
Automation needs to be clearer when crafting bidding strategies. Bidding on low-volume keywords can take a long time to affect search rankings, and B2B businesses typically have very niche keywords.
- Search Term Reports delivered to PPC account managers have multiple keywords hidden, even if those keywords drove conversions.
- Performance-Max ad campaigns do not let PPC account managers add campaign-level negative keywords or put in exclusions.
- The last notable addition that benefitted B2B advertisers was the inclusion of lead form extensions in ad campaigns 2019. Marketers are ready to see new updates, like a new integration to connect LinkedIn B2B audience targeting.
Search ads are most often prioritized over Display and Social ads because they directly contribute to driving conversion. But the latter is equally important since they elevate brand awareness and nurture prospects into paying customers.
However, the KPIs for Display and Social ads differ from those for Search ads and must not be emphasized universally.
- Search ad KPIs are direct conversion metrics, such as conversion rate, cost per conversion, conversion value (revenue), return on ad spend, etc.
- Display and Social ad KPIs are geared towards making a prospect aware of your brand; therefore, the KPIs should be awareness, efficiency, and engagement metrics like impressions, engagements, click-through rate (CTR), cost per click (CPC), cost per 1000 impressions, etc.
To leverage Display and Social ads in the right way to increase brand visibility and boost engagement from your ideal prospects, you can do the following:
- Create Custom Audiences for your Google Ads using your competitors’ brand names and URLs,
- Build out contact lists and website visitor audiences to nurture with remarketing campaigns or excluding new ad campaigns (meant for net-new users), and,
- Add placement exclusions for higher-quality traffic.
Five Tools to Create Your PPC Reports
1. Advertising Dashboards provided by the Platform
The Advertising Dashboard for Google Ads or Facebook Ads helps you stay abreast of the performance status of your ads on these respective platforms. Using these tools, you can also identify the most appropriate keywords that attract your target prospects.
You can use these dashboards to measure important KPIs like clicks, impressions, average conversion value, cost per 1000 impressions, and ROAS. You may also utilize visualizations that support dimensionality because they enable you to split your data based on campaigns, ad sets, or advertisements. Ad accounts are generally linked to personal Google and Facebook accounts, allowing for data transparency and collaboration between multiple stakeholders since most dashboards allow you to link multiple ads accounts.
The analytical dashboard that is natively provided by the advertising platforms you use can very often be sufficient for your needs.
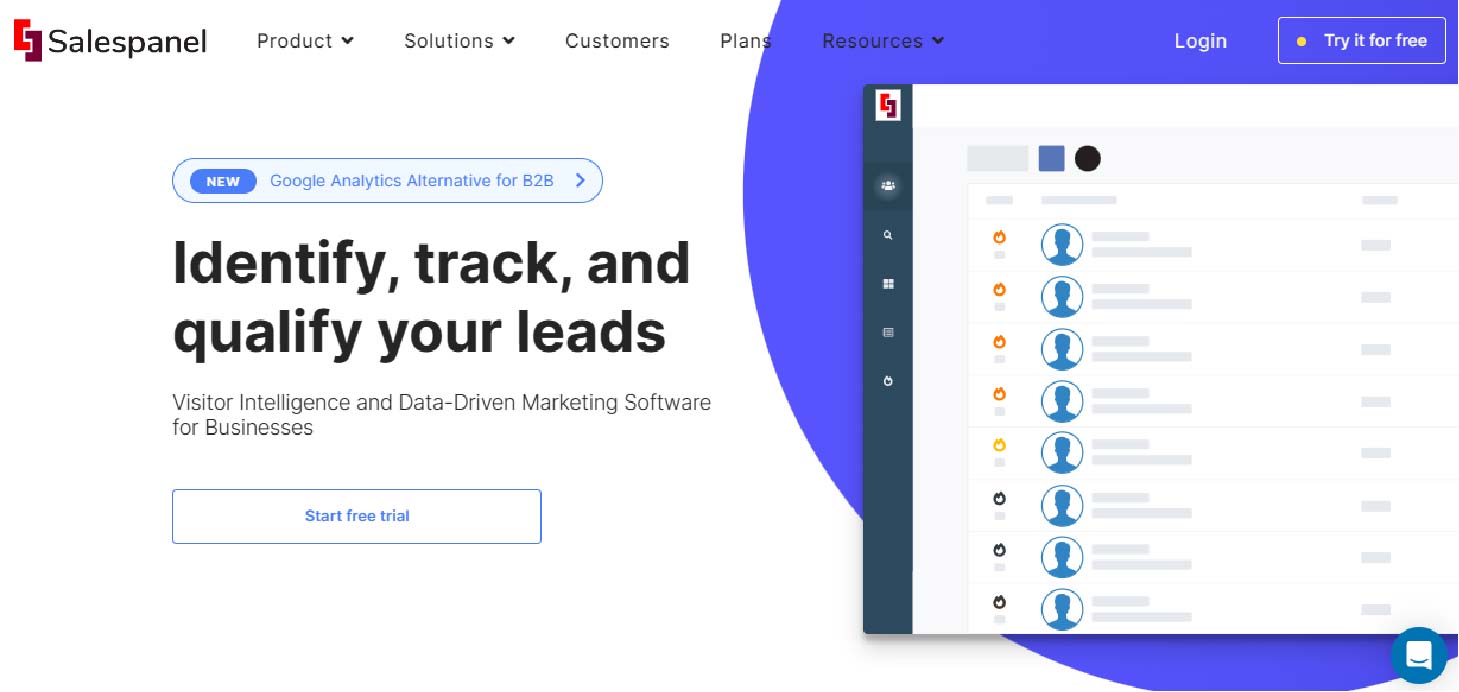
2. Salespanel
Salespanel, as a marketing attribution and customer journey tracking software, acts as a PPC reporting tool that tracks lead sources from each campaign, ad, keyword, etc. Users are tracked in real-time and are marked as “Anonymous Visitors” until they sign up, and you can monitor their activities and segment them based on keywords or campaign types or score them in real-time. The anonymous visitor’s business is also identified if the data is available. Once a lead signs up, this anonymous session marked with the respective email address and the session is tracked until the end of the customer journey.
Salespanel helps you delve into each campaign visitor’s behavioral and firmographic profile data to check if they are ideal leads for you and show buying intent. This is relatively easy to identify, based on whether the lead has signed up on your website, is spending significant time checking pricing pages, completing product demos, etc.
Salespanel tracks the entire customer journey, even before and after conversion, and you can generate reports within the product itself.
3. Supermetrics
Supermetrics is another tool that turns your marketing campaign data into useful insights. It connects with over 70 digital marketing data platforms.
You can load any KPIs and dimensions into your reporting module with Supermetrics, which supports various marketing platforms. You can move your consolidated data to visualization tools like Looker Studio, spreadsheets like Google Sheets and Excel, data warehouses like BigQuery and Snowflake, and data lakes like Google Cloud Storage.
Supermetrics also offers report templates, for instance, for a Google Ads campaign report, preloaded with essential metrics and KPIs to be measured. For smaller teams and enterprises who are just getting started with web analytics and need to process, store, and report on enormous volumes of data from many sources, Supermetrics is one of the best options.
4. Google Analytics / Google Data Studio
Using Google Analytics, you can use tracking codes to monitor your PPC and other campaigns across any advertising platform. If you are using Google Ads, Google’s GCLID tracking system pulls crucial PPC data (which is inaccessible in other tools), directly to Google Analytics.
The product has many important analytical features that are crucial for PPC tracking. For instance, features like the time lag and path length data in Google Analytics let you know how many days pass before a conversion occurs on your website. These reports assist you in estimating how long it will take before you see the full impact of your PPC ads. Moreover, its ‘Assisted Conversions’ report also provides examples of each channel’s involvement. By doing this, you can optimize your PPC budget to spend more on the more profitable channels and less on the less profitable ones.
You can use GA with Google Data Studio, a customized reporting dashboard that seamlessly integrates with all Google-owned platforms, primarily Google Ads. More than 40 templates are already pre-loaded into this tool to help you expedite the reporting process. You can experiment with each aspect, including labels, sizes, colors, and fonts. Interactive reports from Google Data Studio are available for sharing with others.

Best of all, both of these tools are free.
5. Whatagraph
Whatagraph allows you to create a PPC report in minutes—simply by importing all the data from your ads platforms as soon as you connect them to a reporting template. The PPC reporting template allows you to monitor KPIs like total ad spend, ROI, cost per click, etc.
Using a new template to create a cross-channel report and incorporate other marketing channels with PPC is very simple. There are 95+ report templates and 40+ data sources in Whatagraph, so there is something for everyone’s reporting requirements. This makes Whatagraph a very popular option for creating PPC reports.
Trivia: Create PPC reports for your paid ads effortlessly with Salespanel
PPC reporting is crucial to growing your ads account and clocking in the consistent success that ultimately leads to growth and revenue for your business. As mentioned earlier, there is no “one-size-fits-all” strategy for creating the ideal PPC report, but you must be mindful that the metrics you are using suit your unique business objectives and provide a comprehensive overview of your campaign’s reach and performance. If you are a B2B business, Salespanel can be of help!
With Salespanel, you can generate extensive in-depth reports on all of your visitors and leads. Knowledge of the entire customer journey can help you move prospects from one step of the sales funnel to the next, and you can use Salespanel’s centralized data platform to keep track of the entire process. You may also learn what works and what doesn’t by evaluating how each marketing channel, and by extension, each campaign, performs. This will help you improve your marketing strategy. And, more importantly, you can also use PPC data to personalize the experience of your leads.
Interested in learning more? Reach out to us or start your free trial today!
Sell more, understand your customers’ journey for free!
Sales and Marketing teams spend millions of dollars to bring visitors to your website. But do you track your customer’s journey? Do you know who buys and why?
Around 8% of your website traffic will sign up on your lead forms. What happens to the other 92% of your traffic? Can you identify your visiting accounts? Can you engage and retarget your qualified visitors even if they are not identified?