Your sales conversion rate is the ultimate measure of your commercial effectiveness—the percentage of qualified prospects who take a desired revenue-generating action. In a market where customer acquisition costs are steadily rising, this single metric has evolved from a simple performance indicator into the central nervous system of sustainable growth. Ten years ago, a linear sales funnel and a 2% conversion rate might have been acceptable. Today, with the average e-commerce conversion rate doubling from 2.51% in 2018 to 5.40% in mid-2023, that baseline is obsolete. This guide is engineered to provide a technical framework for understanding, benchmarking, and systematically improving this critical metric, ensuring your sales engine is not just running, but accelerating.
The Shifting Landscape of Sales Conversion
A sales conversion rate is not a static figure on a dashboard; it is the direct output of your entire go-to-market strategy. To effectively leverage this metric, one must analyze its historical context and its current trajectory. A decade ago, the path from prospect to customer was more linear, defined by direct sales interactions. The benchmarks for a “good” rate were comparatively modest.
Today’s B2B and B2C buyers are highly informed, conducting extensive independent research before engaging with a sales representative. They expect a seamless, personalized, and data-driven purchasing journey. This fundamental shift in buyer behavior has rewritten the rules of engagement and dramatically altered the mechanics of converting a prospect into a customer.
The Past and Present of Performance
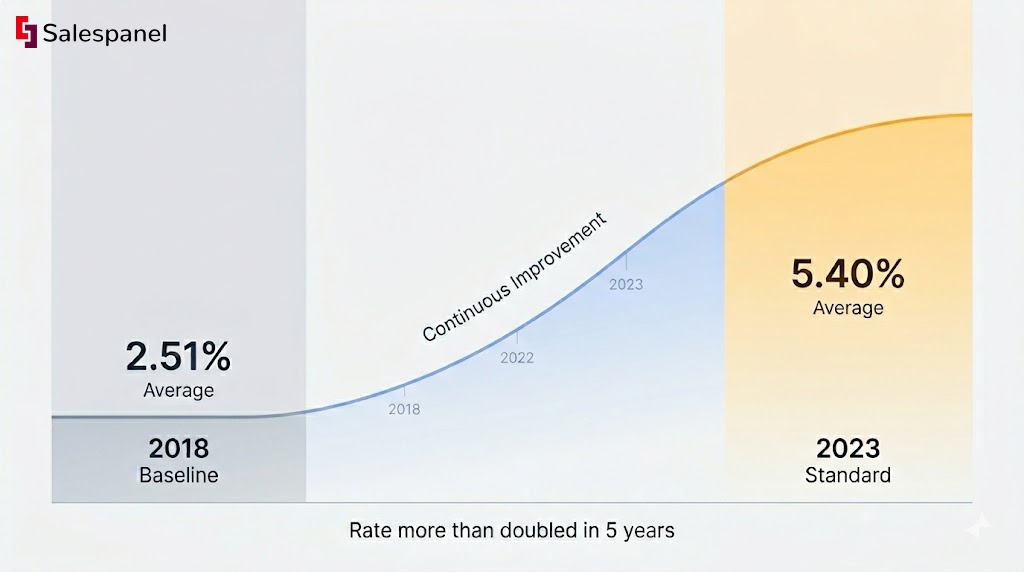
An analysis of performance data reveals a clear upward trend in achievable conversion rates, driven by technological advancements and refined user experiences. The e-commerce sector provides a compelling case study. As online shopping interfaces have become more intuitive and consumer trust has grown, conversion rates have climbed.
In 2018, the average e-commerce conversion rate hovered around 2.51%. By mid-2023, that figure had more than doubled to approximately 5.40%. This significant leap is a direct result of superior analytics, sophisticated marketing automation, and user-centric design principles that minimize friction.
This trend extends beyond retail, underscoring a critical principle for all businesses: yesterday’s peak performance is today’s baseline. The central theme of this guide is that continuous, data-driven improvement is the only viable strategy for succeeding in an increasingly competitive marketplace.
A “good” sales conversion rate is not a fixed target; it is a dynamic benchmark. Elite organizations are not merely focused on exceeding industry averages; they are systematically focused on outperforming their own previous month’s results.
Why This Metric Demands Your Attention
In an economic climate where acquiring new customers is increasingly costly, optimizing the value of every lead is paramount. A stagnant conversion rate is a direct financial liability, representing lost revenue and inefficient resource allocation. If you are not actively optimizing this metric, you are ceding market share to competitors who are.
This guide provides a technical roadmap to:
- Accurately calculate and monitor your most critical conversion events.
- Benchmark your performance against relevant, up-to-date industry data.
- Isolate the key variables that positively and negatively impact your results.
- Implement proven strategies to drive measurable and sustainable improvements.
How to Accurately Calculate Your Sales Conversion Rate
Before any improvement can be made, precise measurement is required. The calculation of your sales conversion rate is the foundational step that provides the empirical data needed to diagnose issues and validate strategies.
The core formula is straightforward, but its utility is determined by the precise application and definition of its components. This is not merely a mathematical exercise; it is about establishing a clear, standardized framework for analysis across your commercial teams.
The basic formula is:
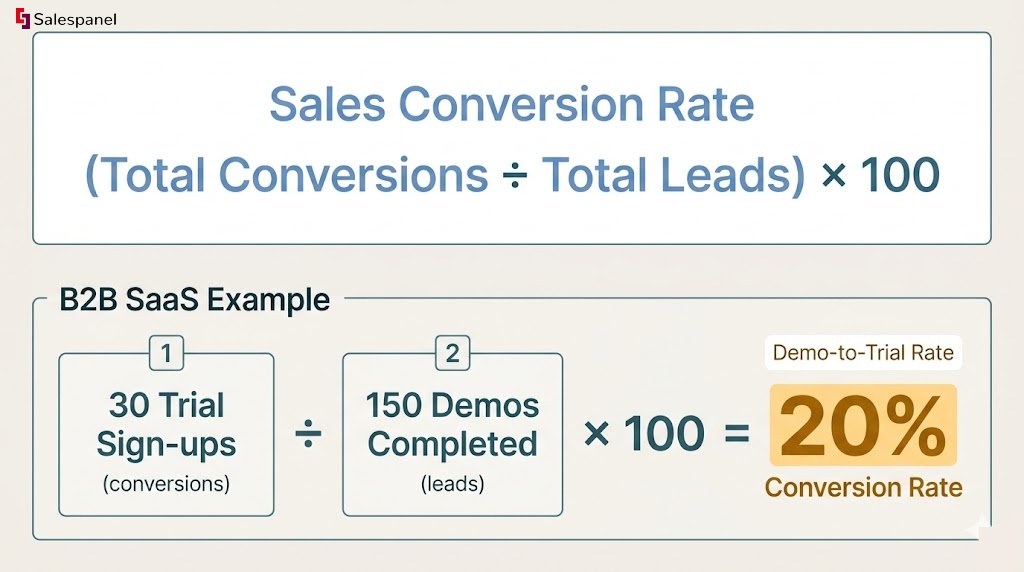
Sales Conversion Rate = (Total Conversions / Total Leads) x 100
While the arithmetic is simple, the variables—’Conversions’ and ‘Leads’—require rigorous definition. Ambiguity here will produce misleading data, leading to flawed strategic decisions. It is critical that sales and marketing departments align on a single, unambiguous definition for each term.
Defining Your Variables
Before applying the formula, your organization must standardize what each variable represents in the context of your specific sales funnel.
- Total Leads: This denominator must represent a qualified cohort, not total website traffic. For the metric to be actionable, ‘leads’ should be defined as Marketing Qualified Leads (MQLs), Sales Qualified Leads (SQLs), or prospects who have completed a specific high-intent action, such as requesting a product demonstration.
- Total Conversions: This numerator represents the successful completion of a defined sales milestone. This could be the transition of a lead from MQL to SQL, the conversion of a product demo into a free trial, or the final conversion of a trial user into a paying customer (Closed-Won).
A common analytical error is to use total website visitors as the ‘Total Leads’ denominator. This artificially inflates the denominator and produces a deceptively low conversion rate that lacks diagnostic value. To derive an actionable metric, the lead pool must be directly relevant to the conversion event being measured.
A Practical B2B SaaS Example
Consider a B2B SaaS company aiming to measure the effectiveness of its product demonstrations in converting qualified prospects into active trial users. This is a critical mid-funnel conversion point that directly reflects the efficacy of the sales presentation and the perceived value of the product.
In the last month, the sales team conducted 150 product demos to qualified leads. Of this cohort, 30 prospects proceeded to sign up for a free trial.
The calculation is as follows:
- Total Conversions (Trial Sign-ups): 30
- Total Leads (Demos Completed): 150
- Conversion Rate = (30 / 150) x 100 = 20%
This 20% demo-to-trial conversion rate is a precise Key Performance Indicator (KPI). The company can now track this metric over time to measure the impact of variables like a new demo script, a product feature release, or sales team training. This type of consistent, segmented tracking is the first step toward building a predictable revenue model.
Benchmarking Your Sales Conversion Rate
Once you have calculated your sales conversion rate, the immediate question is whether the result is optimal. The answer is highly contextual. A “good” conversion rate is relative to industry, business model, price point, and the specific conversion action being measured.
Benchmarking provides the necessary context to interpret your performance data accurately. Comparing a B2B software company’s demo request rate to an e-commerce store’s add-to-cart rate is analytically invalid. A 2% sales conversion rate could be exceptional for a high-value B2B service with a long sales cycle, but it would indicate severe problems for a low-cost, direct-to-consumer product.
Understanding Industry Variations
Performance standards vary dramatically across different sectors. In e-commerce, for instance, the global average sales conversion rate typically falls between 2% and 4%. However, this aggregate figure masks significant granular differences.
Sectors like Food & Beverage often achieve higher rates, with some monthly averages reaching 7.06%. Conversely, high-consideration luxury goods like Jewelry may see rates closer to 1%. Geography is also a factor; the Americas average 3.27%, while the APAC region stands at 2.46%.
The key takeaway is a precise measurement of efficiency: for every 800 qualified leads that entered this stage of the pipeline, the process successfully converted 120 into paying customers.
It’s also crucial to analyze how conversion rates fluctuate by device. User behavior on desktop differs significantly from mobile, and this is reflected in performance data.
Average Sales Conversion Rates by Industry and Device
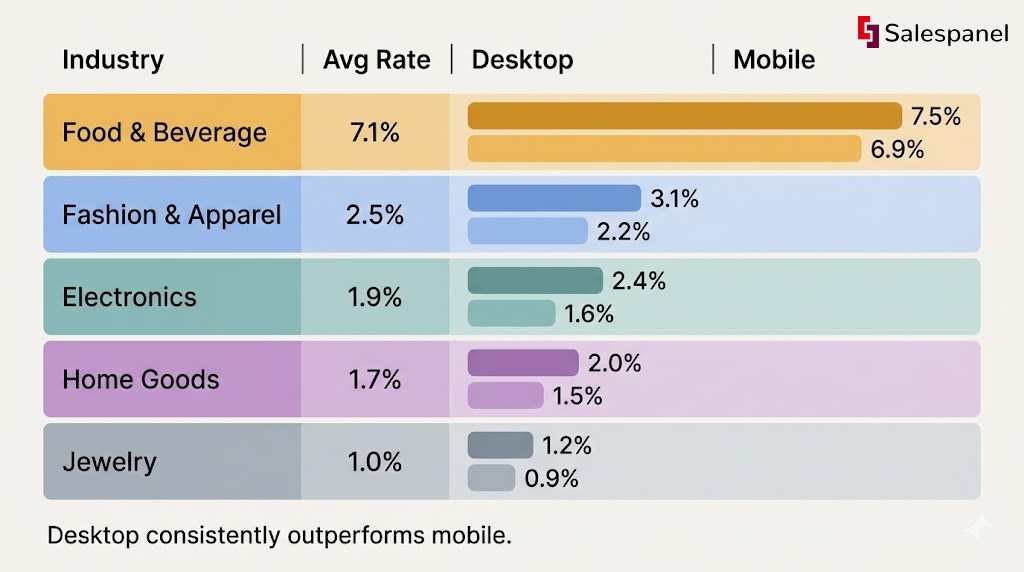
A comparison of typical conversion rates across different e-commerce sectors and how user device impacts performance.
| Industry / Category | Average Conversion Rate | Key Influencing Factor | Desktop Conversion | Mobile Conversion |
|---|---|---|---|---|
| Fashion & Apparel | 2.5% | Visual appeal, brand loyalty, and return policies | 3.1% | 2.2% |
| Electronics | 1.9% | Product specs, reviews, and price comparisons | 2.4% | 1.6% |
| Food & Beverage | 7.1% | Convenience, subscription models, and impulse buys | 7.5% | 6.9% |
| Home Goods | 1.7% | High consideration, detailed product info, and room visualization | 2.0% | 1.5% |
| Jewelry | 1.0% | High price point, trust, and special occasion purchases | 1.2% | 0.9% |
The data indicates that consumers are more likely to complete high-consideration purchases on a desktop, which allows for more detailed review and a greater sense of security. For industries driven by convenience and impulse, the performance gap between desktop and mobile narrows.
Using Benchmarks as a Guide
Industry benchmarks should function as a compass, not a rigid map. They provide directional guidance but should not be treated as absolute targets. The most critical benchmark for any business is its own historical performance. The primary objective should always be continuous improvement against internal metrics.
Use benchmarks strategically:
- Set Realistic Goals: Use industry data to establish achievable targets. If your sector average is 3%, aiming for 3.5% is a strong, quantifiable objective.
- Identify Opportunities: A rate significantly below the industry benchmark is a clear indicator of where to focus optimization efforts, justifying resource allocation.
- Contextualize Performance: Benchmarks provide a powerful way to communicate performance to stakeholders, adding a layer of external validation to internal metrics.
Your most important competitor is your organization’s performance last quarter. While industry data provides a necessary reality check, the central theme of optimization is making incremental, data-driven improvements to your own unique sales process.
Ultimately, a “good” sales conversion rate is one that is consistently improving. By understanding your performance relative to your industry—and more importantly, relative to your own past results—you can construct a sustainable strategy for growth.
Key Factors That Influence Your Conversion Rate
Understanding your conversion rate is the first step; diagnosing the factors that determine it is the critical next step. The rate is not an independent variable but the outcome of an interconnected system. To meaningfully improve it, you must deconstruct this system and analyze its constituent parts.
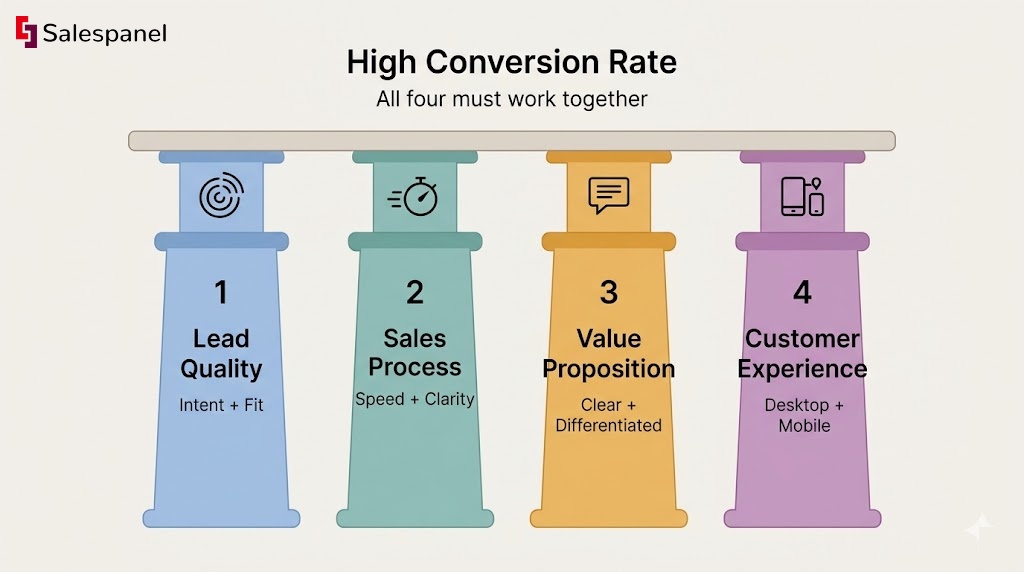
Four primary pillars underpin conversion performance: lead quality, sales process efficiency, value proposition clarity, and the overall customer experience. A deficiency in any one of these areas can compromise the entire structure, regardless of the strength of the others.
Lead Quality
Not all leads possess equal potential. A high volume of low-quality leads—those with poor fit or low purchase intent—will invariably depress your conversion rate. The principle is “garbage in, garbage out.” High-quality leads are defined by intent and fit, not volume.
Top-tier prospects often exhibit buying signals through their pre-conversion behavior. A lead who downloads a generic whitepaper has a different intent level than one who visits the pricing page three times, reads two technical case studies, and engages with a product tour video. This “digital body language” is a strong predictor of conversion potential.
Practical Example: Using a tool for Website visitor tracking from Salespanel allows a business to capture this behavioral data. By identifying visitors who repeatedly engage with bottom-of-funnel content, the sales team can prioritize outreach to prospects who have already demonstrated significant interest, thereby increasing the probability of conversion.
The core objective of conversion rate optimization is efficiency. Focusing sales resources on high-intent leads is the most direct path to improving the sales conversion rate without altering the product or sales team.
Sales Process Efficiency
A cumbersome or unresponsive sales process is a primary driver of prospect attrition. Every point of friction—an overly complex form, a delayed follow-up, an unclear communication—creates an opportunity for a qualified lead to disengage.
An efficient sales process is characterized by responsiveness, clarity, and predictability from the buyer’s perspective. Key friction points to analyze include:
- Slow Response Times: Research indicates that contacting an inbound lead within five minutes increases the likelihood of qualification by 21 times. Delaying by even one hour drastically reduces this probability.
- Excessive Steps: Every additional step in the conversion path, such as requiring multiple forms to book a demo, increases the drop-off rate.
- Lack of Personalization: Generic, templated outreach signals a lack of research and an inability to address the prospect’s specific challenges.
Value Proposition Clarity
This fundamental principle is frequently overlooked. If a prospect cannot immediately grasp what problem you solve, what results they can expect, and what differentiates you from competitors, they will not invest time in further investigation.
Your value proposition must be articulated with precision at every touchpoint, from website copy to sales collateral. It must concisely answer three questions:
- What specific pain point do you eliminate?
- What quantifiable results can be achieved?
- What is your unique competitive advantage?
Customer Experience
Every interaction a prospect has with your brand contributes to their purchasing decision. This extends beyond the sales call to include website navigability, the professionalism of communications, and cross-device functionality.
Device optimization is a critical component of the modern customer experience. Data consistently shows that desktop devices convert at a higher rate (average 4.8%) than mobile devices (2.9%), even though mobile often drives the majority of website traffic (up to 73%). This suggests that many users browse on mobile but prefer to complete high-consideration purchases on a desktop.
Practical Example: An e-commerce site noticing this trend might optimize its mobile experience for information gathering and wish-listing, while ensuring the desktop checkout process is as frictionless as possible. This requires a nuanced approach beyond simple responsive design, focusing on thumb-friendly UI, simplified forms, and accelerated load times.
Proven Strategies to Boost Your Sales Conversion Rate
Transitioning from analysis to action is the definitive challenge in conversion optimization. Effective strategies are not complex; they are focused on systematically improving three core domains: lead qualification, communication relevance, and funnel efficiency. By targeting these areas, you can engineer a sales process that proactively creates conversions.
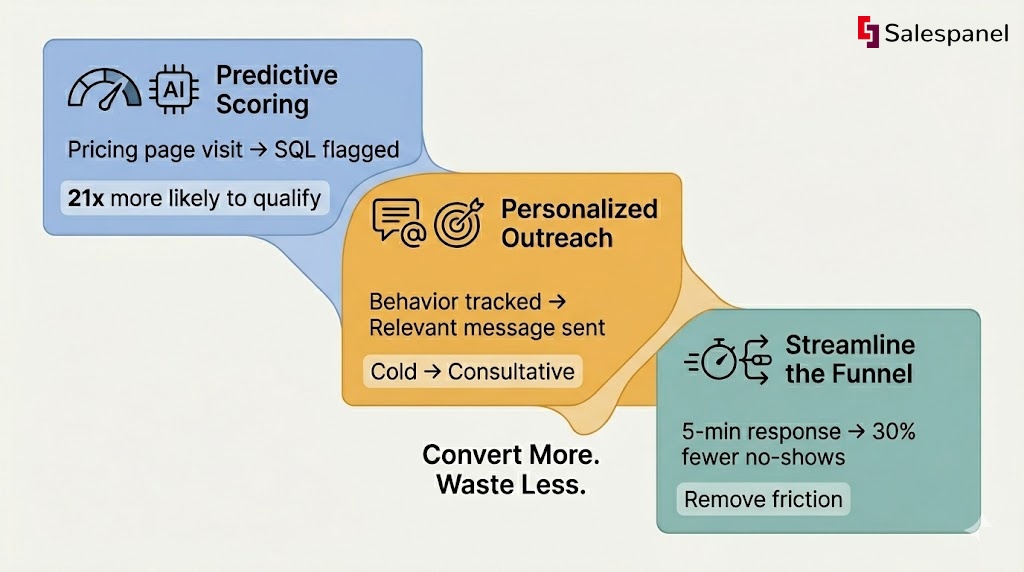
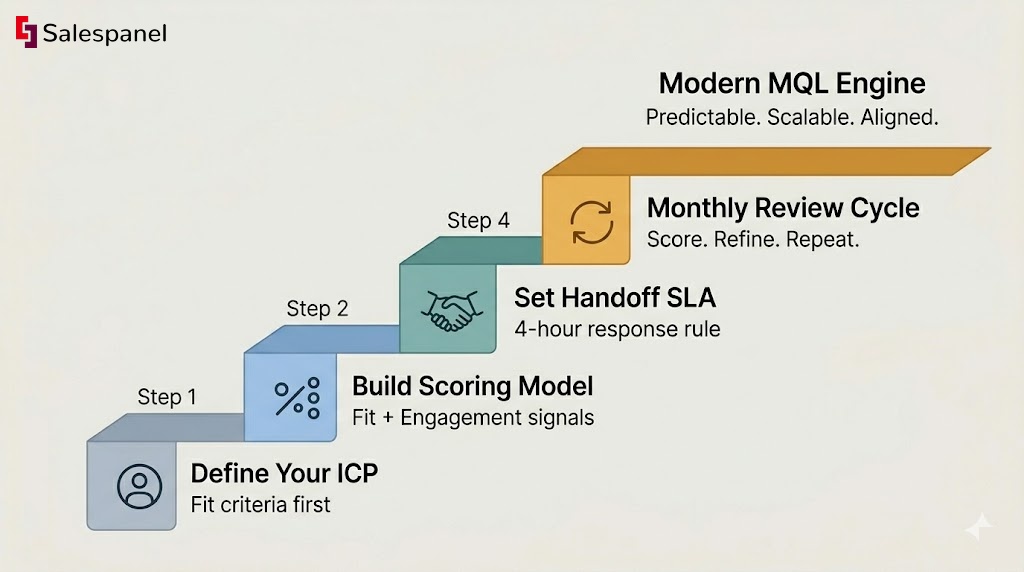
Refine Lead Qualification with Predictive Scoring
A primary inefficiency in any sales organization is the allocation of resources to unqualified leads. The objective is not to engage with every lead, but to engage with the right leads at the optimal moment. Predictive lead scoring is the mechanism to achieve this.
This methodology moves beyond simple demographic data to analyze behavioral signals—a lead’s “digital body language”—to quantify purchasing intent. Salespanel’s lead scoring framework allows you to automate this process by assigning point values to high-intent actions, such as:
- Multiple visits to the pricing page: Indicates serious consideration of budget and solution fit.
- Viewing specific case studies: Shows the prospect is attempting to visualize successful implementation.
- Engaging with bottom-of-funnel content: Actions like using an ROI calculator or watching an on-demand demo are strong buying signals.
Practical Example: By assigning a high score to a lead who visits the pricing page and a technical integration page, the system automatically flags them as an SQL and routes them directly to a sales representative. This data-driven prioritization ensures that sales efforts are focused on leads with the highest statistical probability of closing.
Personalize Outreach at Scale
Generic, mass-market communication is no longer effective. Modern buyers expect outreach that demonstrates an understanding of their specific context and challenges. Personalization is a significant conversion driver, but it must be executed efficiently.
Leverage pre-conversion data to achieve this. With tools like website visitor tracking from Salespanel, you gain visibility into a lead’s on-site activity before the first point of contact.
Practical Example: A prospect spends several minutes reading a blog post and a case study related to your Salesforce integration. Instead of a generic follow-up, the initial outreach can be hyper-relevant: “I noticed your interest in our Salesforce integration. Our clients in the financial services sector typically use this to reduce manual data entry by 40%. Is this a challenge you’re facing?” This transforms a cold outreach into a consultative dialogue, immediately establishing credibility and increasing the likelihood of a positive response.
Streamline the Sales Funnel
Every point of friction in your sales process—an unnecessary step, a confusing form, a delayed response—is an exit ramp for potential customers. To optimize your funnel, you must map the customer journey, identify these friction points, and systematically eliminate them.
Conduct a rigorous audit of your entire sales process, from initial contact to final signature. Ask critical questions at each stage:
- Is scheduling a demo frictionless? Can a prospect book a meeting in two clicks, or are they forced through a multi-page form?
- What is our average lead response time? Data shows that responding within five minutes can dramatically increase qualification rates. How does your team measure up?
- Is our proposal process a bottleneck? Implementing standardized templates and e-signature solutions can reduce the time-to-close from days to hours.
Practical Example: A B2B technology company identified a significant drop-off between demo requests and completed meetings. An audit revealed their scheduling tool offered limited time slots and had a non-intuitive interface. By switching to a more flexible, user-friendly scheduling platform, they reduced their meeting no-show rate by 30%, directly increasing their demo-to-trial conversion rate. This illustrates how addressing seemingly minor operational friction can yield substantial results.
Got Questions About Sales Conversion Rate?
To conclude, let’s address several common technical questions regarding sales conversion rates. This section will clarify key distinctions and provide actionable guidance for implementation.
What’s the Difference Between Sales and Marketing Conversion Rates?
These two metrics are frequently conflated, but they measure success at distinct stages of the customer journey.
A marketing conversion rate measures top-of-funnel (TOFU) and middle-of-funnel (MOFU) effectiveness. It tracks early-stage actions like newsletter sign-ups, ebook downloads, or webinar registrations. Its primary purpose is to measure the efficiency of lead generation and pipeline creation. It generates potential.
A sales conversion rate measures bottom-of-funnel (BOFU) effectiveness. It focuses on how many qualified leads take a definitive sales action, such as requesting a demo, initiating a trial, or completing a purchase. Its purpose is to measure the efficiency of the sales process in turning qualified interest into revenue. It generates revenue.
How Often Should I Be Tracking My Sales Conversion Rate?
The optimal tracking frequency is determined by your sales cycle length and transaction volume. The objective is to identify meaningful trends, not react to statistical noise.
- Short Sales Cycles (e.g., E-commerce, transactional B2B): For businesses with high lead volume and rapid decision-making, weekly tracking is appropriate. This provides rapid feedback on tactical changes like new ad campaigns or website UX adjustments.
- Long Sales Cycles (e.g., Enterprise B2B SaaS): When deals take multiple weeks or months to close, monthly or quarterly tracking is more effective. This smooths out short-term fluctuations and reveals more significant, strategic trends in sales process performance.
The critical factor is not the specific interval, but the consistency of measurement. Only consistent tracking over time can accurately reveal the impact of your optimization efforts.
My Conversion Rate Is Low. Where Do I Even Start?
When facing a low conversion rate, the initial diagnostic focus should be on lead quality, not sales team performance or pricing. A highly skilled sales team cannot effectively convert a pipeline filled with poorly qualified leads.
Begin with a source analysis. Identify which marketing channels are generating your highest-value customers, not just the highest volume of leads. Are the most profitable deals originating from organic search, specific paid campaigns, or partner referrals? Reallocate resources to amplify the channels that deliver high-intent prospects.
Next, analyze pre-conversion behavior. At Salespanel, our philosophy is that a prospect’s digital journey provides the clearest indication of their buying intent. Use tracking to identify leads who exhibit high-intent signals, such as repeat visits to the pricing page or deep engagement with technical documentation. Prioritizing sales outreach to this highly engaged segment is the most efficient path to improving your sales conversion rate.
At Salespanel, we believe that understanding the digital journey is fundamental to maximizing conversions. Our platform is designed to provide the visibility you need to track visitor behavior, score leads based on intent, and personalize outreach for maximum impact. Discover our full suite of resources and begin transforming more prospects into high-value customers at Salespanel Resources.