Sales productivity has fundamentally shifted. Gone are the days when success was measured by the sheer volume of calls in a Rolodex and deals closed on instinct. That analog approach has been replaced by a data-driven science where every digital touchpoint—every click, download, and page view—tells a story. In this new landscape, the difference between a top-performing sales team and one that merely spins its wheels is the ability to interpret that story through precise sales productivity metrics. This isn’t just about working harder; it’s about engineering smarter, more predictable revenue growth.
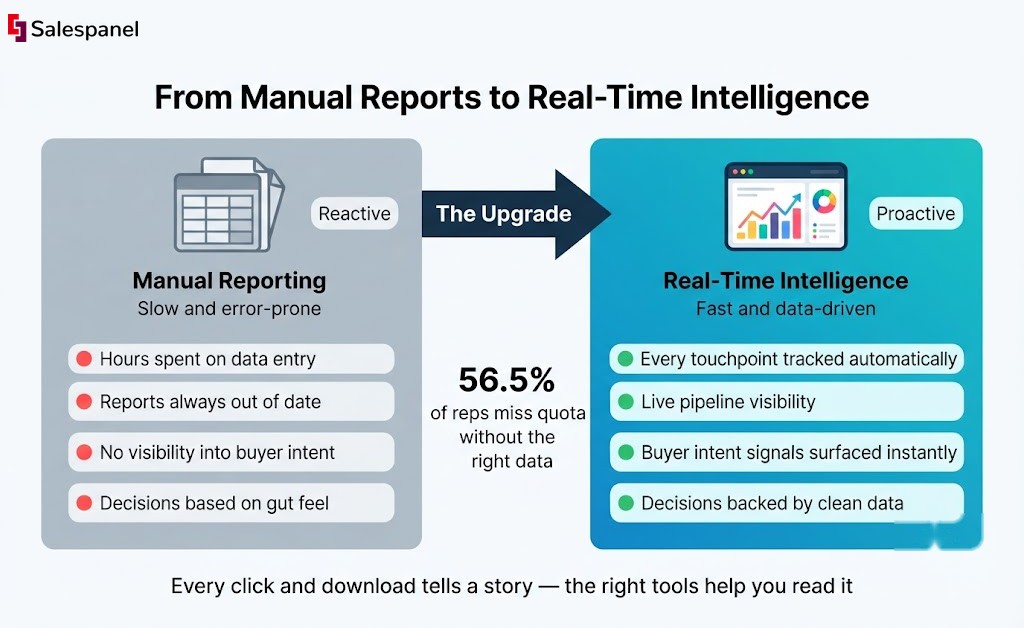
The urgency for this shift is validated by hard numbers. According to recent industry analysis, a staggering 56.5% of sales professionals failed to achieve their quota in Q1 2024. More details on these sales productivity statistics on Everstage.com paint a clear picture: when more than half of a sales force is missing its primary target, the old playbook is officially broken. This guide provides the new one. Our central theme is this: mastering sales productivity requires a relentless focus on connecting specific daily activities to measurable business outcomes. By the end of this article, you will have a practical framework to not only measure what matters but also to take decisive action on those insights to build a more effective, data-driven sales engine.
Before we dive deep, let’s establish a clear map of the core components that define a high-performing sales operation.
Key Sales Productivity Metrics at a Glance
| Metric | What It Measures | Why It’s Critical |
|---|---|---|
| Quota Attainment | The percentage of reps hitting their sales targets. | The ultimate health check of your sales team’s effectiveness. |
| Lead Response Time | How quickly your team follows up with new inbound leads. | Speed is everything. A fast response drastically increases conversion rates. |
| Pipeline Coverage | The ratio of your open pipeline value to your sales quota. | Shows if you have enough fuel in the tank to hit future revenue goals. |
| Sales Cycle Length | The average time it takes to close a deal from first contact. | Reveals friction points and helps forecast revenue more accurately. |
| Win Rate | The percentage of opportunities that convert into closed-won deals. | A direct measure of your sales process’s effectiveness and your team’s skill. |
This table provides a high-level overview, but the real strategic advantage comes from understanding the narrative these metrics create when analyzed together.
The Growing Urgency for Data-Driven Sales
Today’s B2B sales landscape is more challenging than ever. Sales cycles are elongating, buyers arrive armed with extensive research, and competition is relentless. In this environment, quota attainment serves as the most direct measure of success or failure. The fact that nearly six out of ten reps are missing their targets is a clear signal of systemic inefficiency. It points to a breakdown in process, strategy, or both. Sticking to outdated methods is a recipe for stagnation.
Moving Beyond Vanity Metrics
To not just survive but thrive, sales leaders must transition from tracking “vanity metrics”—like the raw number of calls made—to focusing on metrics that reveal tangible business impact. The core pursuit of this guide is to demonstrate that sustainable success is born from working smarter. That journey begins by measuring what truly matters.
The goal is not just to measure activity, but to understand its quality and impact. A high volume of calls that generates no qualified pipeline is not productivity; it’s wasted energy. True productivity is about maximizing the revenue generated from every hour a rep invests.
This requires a framework that connects daily tasks to real, tangible outcomes. By building this data-driven foundation, you can shift from constantly reacting to market pressures to proactively shaping your strategy and building a predictable engine for growth. This article will provide that framework, detailing precisely which metrics to track, how to measure them, and how to leverage them to construct a more dominant and effective sales organization.
Distinguishing Activities From Outcomes
In the world of sales productivity, it’s easy to get lost in a sea of data. Many organizations fall into the trap of measuring every possible action, creating dashboards filled with noise that obscure the underlying truth of performance. To build a system that drives predictable revenue, you must begin with a foundational principle: you must separate the work from the results. This means structuring your metrics into two distinct categories: activities (leading indicators) and outcomes (lagging indicators).
This distinction is critical. Imagine a team making hundreds of calls and sending thousands of emails daily. This represents high activity. However, if those efforts fail to generate qualified pipeline and closed deals, the outcomes are poor. All that activity is just motion without progress. A practical example would be an SDR team that is incentivized purely on call volume. They may hit their call targets, but if those calls are to poorly qualified lists, the downstream conversion rates will suffer, proving the activity was unproductive. The key is to ensure the right activities are being executed effectively to produce the desired outcomes.
The Anatomy of Activity Metrics
Activity metrics, also known as leading indicators, measure the raw effort your sales team puts in. They are proactive and predictive, offering an early glimpse into future performance. Strong and consistent activity numbers suggest that the pipeline should begin to fill. These are the metrics sales managers monitor closely, often on a daily or weekly basis, to ensure the sales engine is running.
Key activity metrics include:
- Number of Calls Made: The total volume of outbound calls initiated by a rep, representing a pure measure of prospecting effort.
- Number of Emails Sent: The total count of outreach emails, serving as a top-of-funnel volume metric similar to calls.
- Meetings Booked: The number of initial discovery calls or demos scheduled. This is a higher-quality activity metric because it validates that the outreach successfully captured a prospect’s interest.
A practical analysis here is crucial. For instance, if a sales rep makes 100 calls and books only one meeting, while another makes 50 calls and books five meetings, the second rep is far more productive. The data signals a need for investigation: Is the first rep using a weak script? Is their target list poorly qualified? Are they calling at suboptimal times? Diagnosing this disconnect is how you turn activity into productivity.
Activity metrics don’t tell you if you’re winning, but they do tell you if you’re even in the game. They measure the inputs required for success, making them the first place to look when the pipeline starts to run dry.
The Significance of Outcome Metrics
Outcome metrics, or lagging indicators, measure the results of all that activity. They are historical, telling you what has already happened. While you cannot directly change them in the moment, they are the ultimate arbiters of your success and reveal the true effectiveness of your sales strategy. These are the metrics that resonate most with CEOs and board members.
Essential outcome metrics include:
- Conversion Rate: The percentage of opportunities that advance from one stage of the sales funnel to the next. For example, the rate at which demos convert into qualified pipeline opportunities.
- Win Rate: The percentage of all qualified opportunities that result in a closed-won deal. This is a direct measure of closing effectiveness.
- Average Deal Size: The average revenue value of a closed-won deal, which indicates the quality and profitability of the business being closed.
- Sales Cycle Length: The average time it takes to close a deal from the initial touchpoint, exposing the efficiency of the entire sales process.
Consider this practical example: a team boasts a high win rate but a very low average deal size. This pattern suggests they are adept at closing but may be focusing on a less profitable market segment or failing to upsell. Conversely, a long sales cycle might indicate process bottlenecks, such as a slow legal review process or inconsistent follow-up from reps. By focusing on both activities and outcomes, you create a balanced and comprehensive view of performance, ensuring that hard work translates directly into tangible business results.
Measuring What Truly Drives Sales Effectiveness
It’s easy to get caught up tracking activities. How many calls did we make? How many emails went out? While that tells you if your team is busy, it says nothing about whether they’re being effective. To get to the real story, you have to look past the raw effort and zero in on the KPIs that have a direct line to revenue. These metrics serve as a comprehensive health check for your entire sales motion. They address the critical questions: Are reps skilled at closing deals? Is our sales process efficient or riddled with friction? Are we securing the right type of business? To find these answers, you must delve into three cornerstone metrics: quota attainment, win rate, and sales cycle length.
This graphic really nails the connection between the daily hustle and the results they’re supposed to generate.
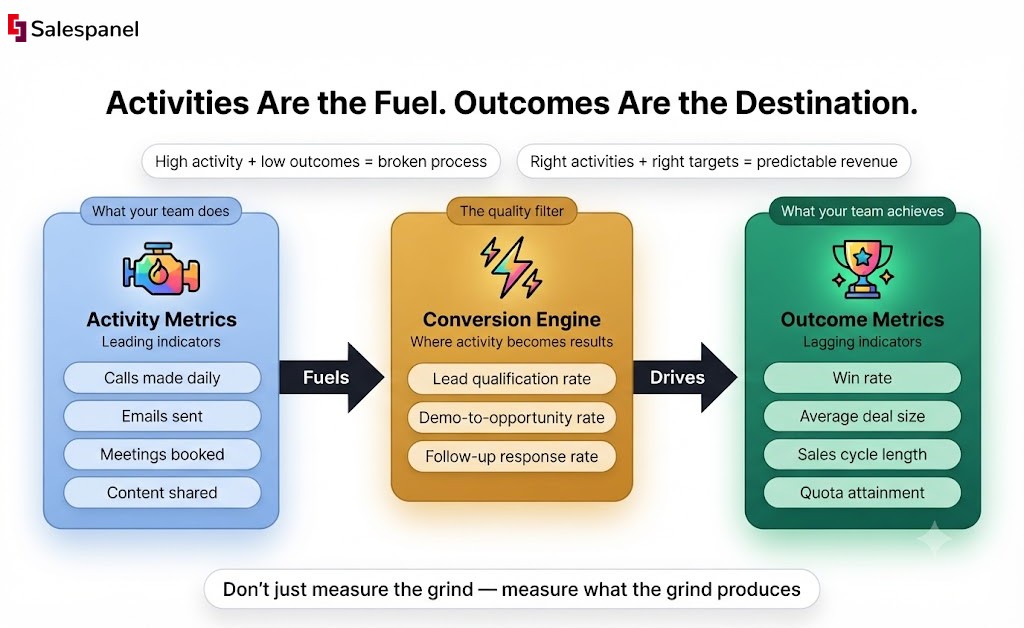
Think of it this way: activities are the fuel, but outcomes are the destination. One without the other is just a great way to waste gas.
Unpacking Key Effectiveness Metrics
Let’s break down the KPIs that form the foundation of how we measure effectiveness. Each one offers a different, crucial perspective on performance.
- Quota Attainment Percentage: This is the ultimate bottom line. It shows you what percentage of your team is actually hitting their revenue targets. It’s the most straightforward way to see if your team is delivering on its core financial promise. Formula: (Total Revenue Closed / Sales Quota) x 100
- Win Rate: This metric cuts right to the chase—of all the qualified opportunities your team works, how many do they actually win? It’s a direct reflection of their closing ability and the overall strength of your sales process. Formula: (Number of Closed-Won Deals / Total Number of Opportunities) x 100
- Sales Cycle Length: This is simply the average time it takes to get a deal from first contact to a signed contract. A shorter cycle usually means you have a smooth, efficient sales process without a lot of friction slowing things down. Formula: Total Number of Days to Close All Deals / Number of Deals
On their own, these numbers are interesting. But their true power comes alive when you start looking at them together to figure out where the cracks are in your sales strategy.
Diagnosing Performance with Effectiveness KPIs
Picture this scenario: your dashboard shows a high volume of booked demos (an excellent activity metric), but your win rate is stubbornly low. This pattern is a significant red flag. It indicates your reps are proficient at generating initial interest but are failing somewhere deeper in the sales process.
This disconnect could point to several underlying issues:
- Poor Qualification: Reps might be scheduling demos with anyone who expresses slight interest, wasting time on leads that were never a good fit. A practical fix is to implement a stricter qualification framework like BANT or MEDDIC.
- Ineffective Demos: The product demonstration itself might be failing to connect product features to the prospect’s specific pain points. Coaching reps to tailor demos based on pre-call discovery can address this.
- Weak Closing Skills: The team may lack the skills to handle objections, negotiate terms effectively, or create the urgency needed to finalize the deal. Targeted training on closing techniques would be a direct solution.
Similarly, an extended sales cycle could signal process friction, such as a bottleneck in legal review or reps failing to establish clear next steps, allowing deals to languish. The win rate, in particular, offers a raw assessment of a team’s closing capabilities. According to benchmarks, the standard opportunity win rate for B2B sales teams is a mere 6%. This figure, which has seen little improvement despite new technologies, highlights the difficulty of navigating complex deals with multiple stakeholders. You can read more about key B2B sales benchmarks on Revenue.io.
By weaving these metrics together, you stop just observing performance and start actively diagnosing it. You’re no longer asking “What happened?” but “Why did it happen?” and “How do we fix it?”
Introducing Pipeline Velocity: The Ultimate Metric
While each of those metrics is valuable, you can combine them into one incredibly powerful master metric: Pipeline Velocity. This KPI measures how fast qualified deals are moving through your sales pipeline and turning into actual revenue. Think of it as the speedometer for your sales engine. Pipeline Velocity synthesizes four distinct data points to provide a single, holistic number reflecting the health and speed of your entire sales process.
Here’s the formula:
(# of Opportunities x Average Deal Size x Win Rate) / Sales Cycle Length (in days)
A higher velocity means more revenue, faster. By monitoring this single metric, you can instantly see the combined effect of your team’s ability to generate opportunities, win them, increase their value, and shorten the sales cycle. For any sales leader, it is the most direct way to measure—and forecast—the momentum of their revenue engine.
How to Build Your Sales Productivity Dashboard
A collection of metrics is simply noise until it is organized into a coherent narrative. A well-designed dashboard achieves exactly that—it transforms raw numbers into a clear, actionable story about your sales team’s true performance. The objective is not to overload a single screen with every possible chart but to create a visual flow that guides you from a high-level overview down to the specific details demanding attention.
The central theme of any great dashboard must be trust. If the data is unreliable, the entire exercise is futile. This requires building your dashboard on a solid foundation of clean, consistent data collection and accurate attribution. In an era of fragmented customer journeys and data privacy shifts, establishing a single source of truth is both the greatest challenge and the most critical step.
Establishing Your Data Foundation
Before designing a single chart, you must ensure the underlying data is both accurate and complete. Inaccurate data inevitably leads to flawed conclusions and misguided strategies. Many teams falter here, relying on client-side tracking that misses significant portions of the customer journey, such as server-to-server interactions or offline events. This is why a robust, unified tracking mechanism is non-negotiable. For instance, Salespanel’s server-side tracking is engineered to unify customer journey data from every touchpoint—website visits, CRM updates, backend events—into a single, cohesive profile. This ensures the sales productivity metrics on your dashboard reflect reality, not just a convenient fraction of it.
A dashboard is only as reliable as its weakest data point. Investing in a single source of truth isn’t a luxury; it’s the prerequisite for making intelligent, data-driven decisions that actually grow your business.
Once your data is locked down and trustworthy, you can start structuring your dashboard to tell a compelling story.
Structuring Your Dashboard for Clarity
A powerful sales dashboard should be built like a pyramid. The most critical, high-level outcomes sit at the top, with the granular, diagnostic metrics forming the base. This structure allows leaders to get a quick health check at a glance, then drill down to understand the “why” behind the numbers.
Here’s a practical template for how you can structure your own dashboard:
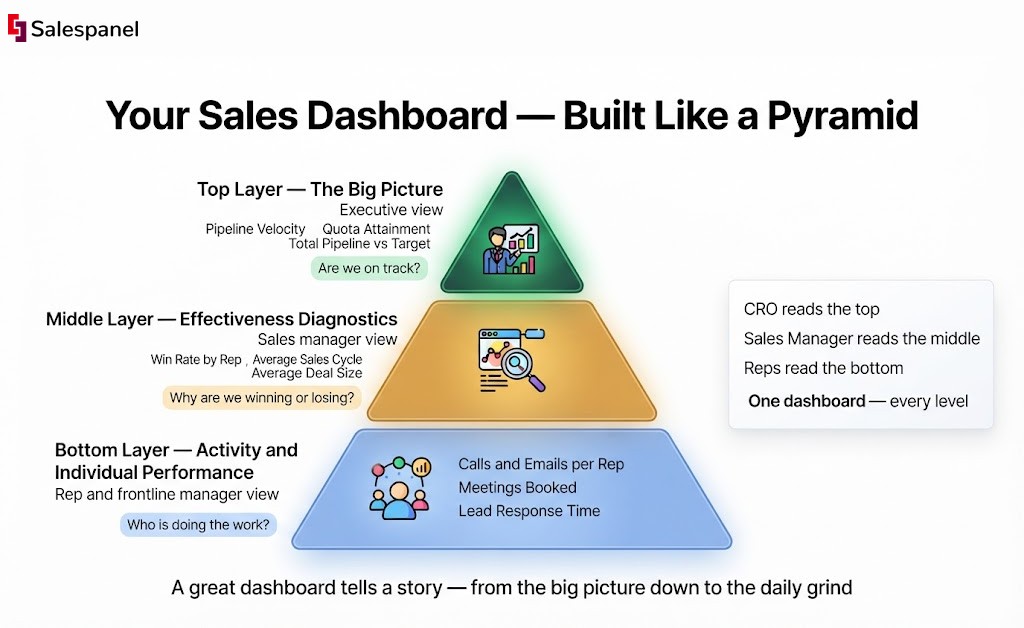
- Top Layer (The Big Picture): This is for the executive-level view. It should answer one simple question: “Are we on track to hit our number?” Pipeline Velocity, Quota Attainment (Team-wide), and Total Pipeline Value vs. Target.
- Middle Layer (Effectiveness Diagnostics): This is where sales managers live. Win Rate by Rep/Team, Average Sales Cycle Length, and Average Deal Size.
- Bottom Layer (Activity and Individual Performance): This is for frontline managers and individual reps. Activities per Rep (Calls, Emails), Meetings Booked, and Lead Response Time.
This tiered structure ensures that everyone in the sales org, from the CRO to the newest BDR, can look at the same dashboard and pull the specific insights they need to do their job better. It turns a static report into a dynamic tool for coaching, forecasting, and strategic planning.
Putting Your Metrics to Work: Actionable Strategies
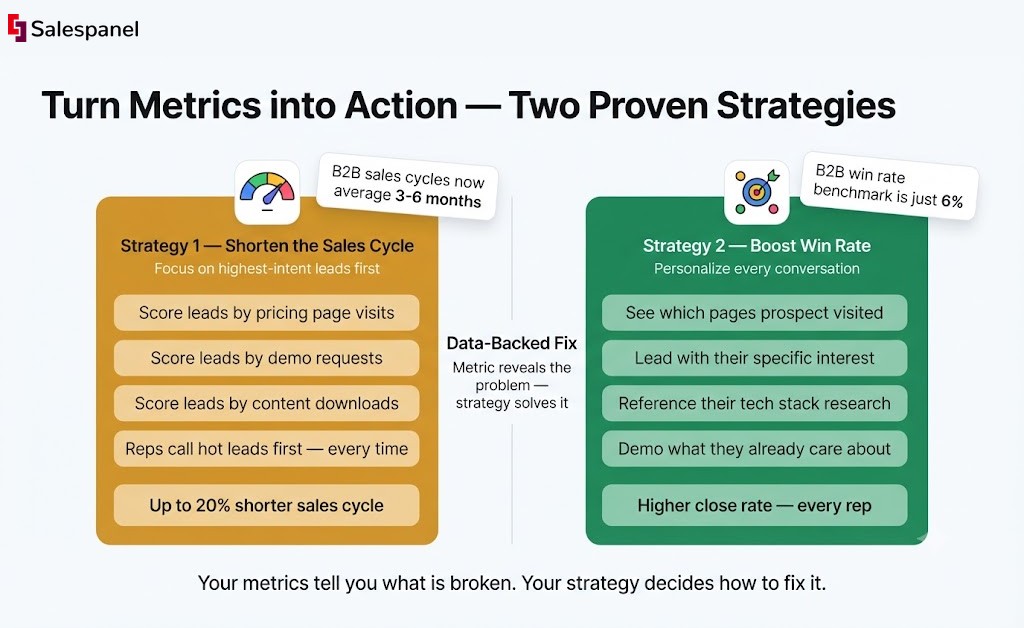
Analyzing your sales productivity metrics is the first step; the real value is unlocked when you use that data to drive intelligent action. Once your dashboard flags a problem—such as a stalled pipeline or a declining win rate—a clear, targeted plan is essential. This is the bridge between insight and revenue. The core principle is straightforward: identify the specific bottleneck and implement a precise solution. For example, if your team is struggling with a long sales cycle, the directive to “sell faster” is ineffective. The practical solution is to equip them to focus their energy on leads demonstrating the highest buying intent.
Shorten a Long Sales Cycle with Lead Prioritization
A sales cycle that drags on is often a symptom of a single, critical issue: reps are spending too much time on prospects who are not yet ready to buy. They treat every lead equally, diluting their efforts instead of concentrating on deals with momentum. The solution is to provide them with the intelligence to know exactly who to contact first. Salespanel’s lead scoring framework automates this process. It analyzes prospect behavior—such as visiting the pricing page, requesting a demo, or downloading a case study—and assigns a numerical score based on their buying intent. Reps can then see at a glance which leads are “hot,” enabling them to prioritize their day and focus on conversations that are more likely to close, and close faster.
This is particularly impactful in B2B, where sales cycle length has become a significant challenge. Recent benchmarks indicate average cycles are now 3-6 months in major markets, an increase driven by economic shifts. Teams leveraging AI-driven insights have managed to reduce this time by up to 20% by accurately predicting which opportunities are ready to accelerate.
Boost a Low Win Rate with Personalized Outreach
A low win rate is often a direct result of generic, one-size-fits-all sales pitches. When reps lack insight into a buyer’s specific interests, their message fails to resonate, and the opportunity is lost. Personalization is the key to reversing this trend. By using website visitor tracking from Salespanel, your reps gain a significant strategic advantage. Before initiating contact, they can see precisely which pages, products, or features a prospect has viewed on your website. This is not just data; it is a roadmap to a relevant and impactful conversation.
For example, a rep notices a prospect has spent ten minutes on a specific integration page. Instead of a generic opening, they can lead with, “I saw you were looking into how our platform connects with your existing tech stack. Let’s discuss how we can make that integration seamless for you.” This level of personalization directly addresses the prospect’s immediate interests, builds instant rapport, and dramatically increases the probability of winning the deal.
Improving your metrics isn’t about blowing up your entire sales process overnight. It’s about making small, precise, data-backed adjustments that solve specific problems, one metric at a time. The right tool gives you the insight, but the right strategy is what turns that insight into action.
For a deeper dive, exploring proven strategies to improve sales productivity from a RevOps perspective can add even more firepower. The goal is to build a repeatable system where data continuously sharpens your team’s approach, turning your sales organization into a more efficient and powerful revenue engine.
Where Do We Go From Here? The Future of Measuring Sales Productivity
The landscape of sales analytics is undergoing a profound transformation. Historically, it has been a retrospective exercise—reporting on past performance. That is changing. Driven by significant advancements in artificial intelligence and a necessary pivot toward data privacy, the industry is shifting from a reactive posture to a proactive, predictive strategy for revenue growth. This evolution is not about replacing salesperson intuition but about augmenting it with powerful analytical capabilities. The timeless goal of working smarter, not harder, remains, but the tools to achieve it are becoming exponentially more intelligent.
AI and Predictive Analytics in Sales
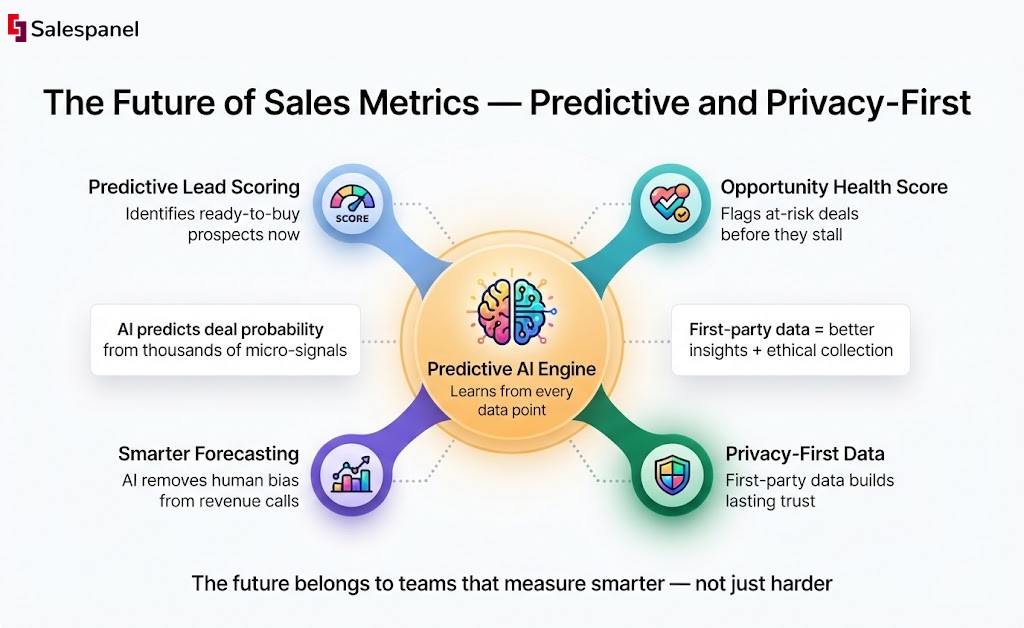
The next frontier for sales productivity is dominated by predictive analytics. AI has transcended its status as a mere marketing buzzword to become a suite of practical, powerful tools capable of sifting through vast amounts of historical data to forecast future outcomes with remarkable accuracy. Instead of simply tracking a rep’s historical win rate, AI can now predict the probability of a specific deal closing by analyzing thousands of micro-signals in real-time.
This has a direct and measurable impact on the core sales productivity metrics discussed throughout this guide:
- Predictive Lead Scoring: AI models analyze firmographic data and real-time behavioral signals to identify prospects who are not only a good fit but are also ready for a sales conversation now. This enables teams to focus their efforts with surgical precision.
- Opportunity Health Scoring: By monitoring email sentiment, engagement levels, and deal progression, AI can assign a “health score” to each opportunity, helping managers identify at-risk deals long before they stall.
- Smarter Forecasting: Moving beyond simplistic pipeline calculations, AI can incorporate variables like seasonality, a rep’s historical performance, and broader market trends to generate revenue forecasts that are significantly more reliable and less prone to human bias.
Privacy-First Data Collection Is an Opportunity, Not a Hurdle
Concurrently, the rise of data privacy regulations is fundamentally altering how information is gathered. While many view this as a constraint, it presents a significant strategic opportunity. The deprecation of third-party cookies is compelling businesses to adopt a practice they should have embraced all along: building trust and collecting high-quality, first-party data directly from their audience.
In this new era, the game is no longer about the quantity of data you can scrape together. It’s about the quality and context of that data. Ethically sourced, first-party information gives you a much clearer, more honest view of what a buyer is thinking, which leads to better insights and personalization that actually feels helpful, not creepy.
This aligns perfectly with the philosophy at Salespanel, which is built on using comprehensive, ethically-sourced data to power smarter sales plays. When your data foundation is built on trust and transparency, you cultivate richer insights that fuel more accurate and effective sales productivity measurement. The future belongs to sales leaders who embrace these changes, fostering a resilient, data-driven culture equipped with the right metrics and tools.
Have Questions? We’ve Got Answers.
As you start putting these sales productivity metrics into practice, questions are bound to pop up. It’s totally normal. Here are some straightforward answers to the things sales leaders most often ask us.
How Often Should We Be Looking at These Metrics?
There’s no single right answer here—it really comes down to what you’re measuring.
- Activity Metrics: Things like calls made and emails sent are best tracked daily or weekly. This rhythm lets individual reps and their managers make quick tweaks to their daily hustle. It keeps everyone on track without waiting for a month-end report.
- Outcome & Effectiveness Metrics: The bigger picture stuff—like win rate, quota attainment, and sales cycle length—makes more sense to review monthly and quarterly. You need that much time to see real trends emerge. This is where sales leadership can make strategic decisions that impact the whole team.
The real key is consistency. Use the data to fuel your coaching sessions, not just to fill a spreadsheet.
What’s the Real Difference Between Sales Productivity and Sales Performance?
Great question. People throw these terms around interchangeably, but they measure two very different—though related—things.
Sales performance is all about the final results. The “what.” Think total revenue closed or whether a rep hit their quota.
Sales productivity, on the other hand, is about the “how.” It measures the efficiency and effectiveness of the effort it took to get those results. For instance, two reps could hit the exact same quota (equal performance), but if one did it with half the calls and meetings, their productivity is through the roof. Focusing on productivity is how you scale success without just telling everyone to “work harder.”
If You Had to Pick Just One Metric, Which Is the Most Important?
If I had to bet on a single metric to give me a pulse on the health of a sales engine, it would be Pipeline Velocity.
Why? Because it’s not just one number; it’s a powerful formula that rolls several critical factors into one. It combines the number of opportunities, average deal size, win rate, and sales cycle length.
In short, it tells you how fast deals are actually moving through your pipeline and turning into cash. It’s a holistic, dynamic view of your entire sales process’s health and efficiency. If that number is trending up, you’re doing something right.
Ready to stop guessing and start knowing? At Salespanel, we give you the tools to track, analyze, and actually improve the metrics that drive your business forward.
Explore Our Resources