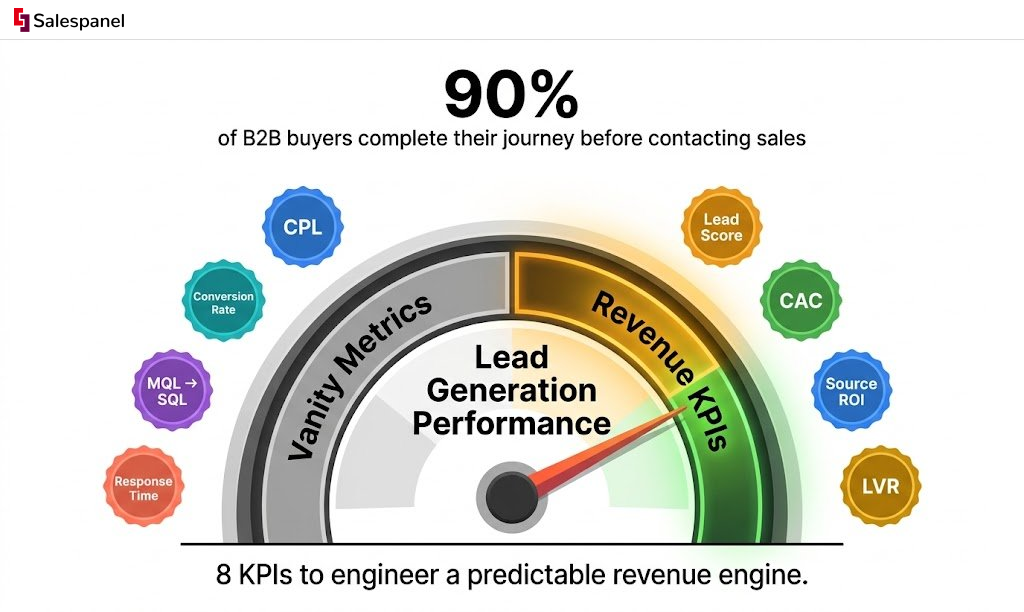
In the past, B2B marketing success was often a volume-based numbers game: more leads, more clicks, more traffic. The prevailing wisdom was that a wider net would inevitably yield more fish. Today, this approach is dangerously obsolete. The modern buyer’s journey has been fundamentally re-engineered. According to Forrester, B2B buyers now complete as much as 90% of their journey independently before ever speaking to a salesperson. This seismic shift from sales-led discovery to self-directed education demands a more sophisticated, data-driven strategy where precision trumps volume. To truly understand the vital signs of your online campaigns and move beyond vanity metrics, it’s crucial to master your lead generation key performance indicators.
The central challenge is no longer merely generating leads, but generating the right leads and proving marketing’s direct, quantifiable impact on revenue. Superficial metrics like website traffic or download counts fail to tell the full story and can obscure poor performance. This article moves beyond this surface level to provide a definitive guide to the eight lead generation key performance indicators that matter most in this new era. We will dissect each KPI with journalistic precision, offering technical validation, practical examples, and actionable takeaways. Our central theme is transforming your lead generation from a cost center into a predictable, high-performing revenue engine.
1. Cost Per Lead (CPL)
Cost Per Lead (CPL) is one of the most fundamental lead generation key performance indicators, offering a direct measure of your marketing efficiency. It calculates the exact cost to acquire one new lead for your business, providing a clear financial benchmark for your campaigns.
The formula is straightforward: Total Marketing Campaign Spend ÷ Total New Leads Generated = CPL. This KPI is crucial because it connects marketing efforts directly to the budget, allowing you to assess the financial viability of different channels and strategies. Without tracking CPL, you are essentially flying blind, unable to determine which activities generate leads cost-effectively and which are draining your resources. A practical example would be a company spending $5,000 on a LinkedIn Ads campaign that generates 50 leads; their CPL for that campaign is $100.
Why CPL is a Critical KPI
Tracking CPL allows you to optimize your budget allocation with precision. For instance, Salesforce meticulously tracks CPL across its numerous channels to strategically allocate its multi-billion dollar marketing budget. This data-driven approach ensures investment is funneled into the highest-performing channels, maximizing return. A more tactical example is Dropbox, which famously leveraged a referral program that resulted in a CPL of just $233, significantly lower than the $388 CPL from traditional paid advertising, demonstrating the power of optimizing for this metric.
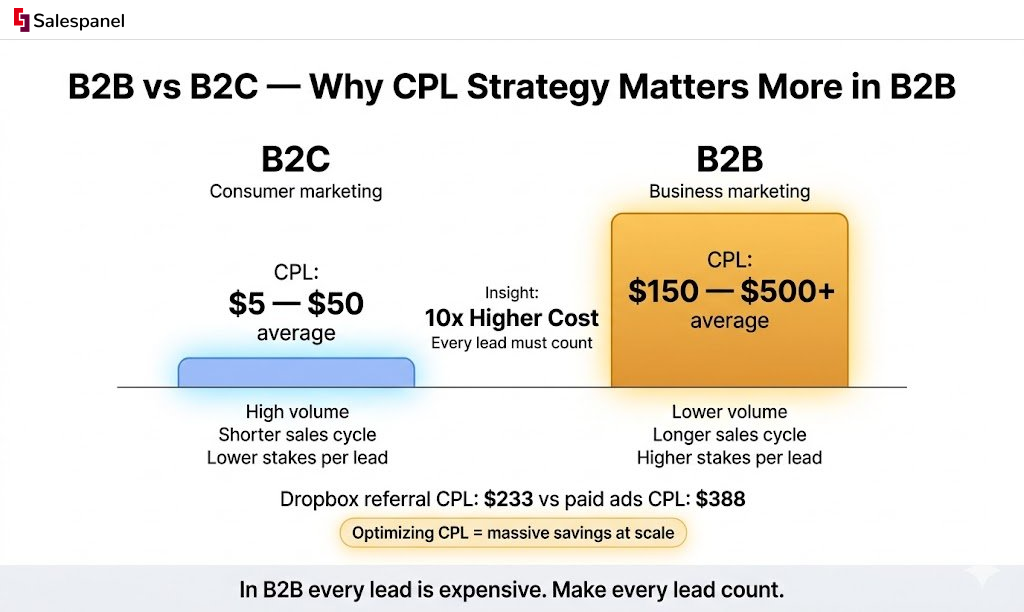
This visualization highlights why B2B companies must be particularly strategic with their lead generation, as the higher acquisition cost necessitates a more calculated and efficient approach.
How to Optimize Your CPL
Continuously improving your CPL is key to scaling your lead generation efforts sustainably. Here are actionable tips to lower your costs while maintaining lead quality:
- Segment by Channel: Track CPL for each marketing channel (e.g., Google Ads, LinkedIn, SEO, content marketing) separately. This reveals which channels are your most efficient and which require optimization or divestment.
- A/B Test Everything: Continuously test ad copy, landing page designs, calls-to-action (CTAs), and offers. Small improvements can lead to significant reductions in your CPL over time.
- Refine Your Targeting: Ensure you are reaching the most relevant audience. Poor targeting leads to wasted ad spend and high CPL. Use demographic, firmographic, and behavioral data to narrow your focus.
- Improve Lead Quality: A low CPL is meaningless if the leads are poor quality. Implement lead scoring to ensure your marketing efforts attract prospects who are genuinely a good fit for your product or service.
2. Lead Conversion Rate
Lead Conversion Rate is a pivotal lead generation key performance indicator that measures the percentage of leads that successfully move to the next stage of your funnel. It’s the ultimate test of how effectively your marketing and sales efforts persuade prospects to take a desired action, turning initial interest into tangible progress toward a sale.
The formula is straightforward: (Number of Converted Leads ÷ Total Number of Leads) x 100 = Lead Conversion Rate %. This metric is crucial because it goes beyond lead volume to assess lead quality and the effectiveness of your lead acquisition processes. A high volume of leads is meaningless if none of them convert, making this KPI essential for evaluating the actual performance of your sales pipeline.
Why Lead Conversion Rate is a Critical KPI
Tracking Lead Conversion Rate reveals the health of your entire funnel, from top to bottom. It helps you understand if your marketing is attracting the right audience and if your sales team has the resources to close deals effectively. For a practical example, Marketo famously improved its conversion rates from a mere 0.75% to an impressive 9.3% by implementing robust lead scoring and personalization. Similarly, Zillow achieved an 18% conversion rate by meticulously optimizing its landing pages and using progressive profiling to reduce friction for potential leads.
These examples demonstrate that a focus on conversion rate forces a holistic review of the customer journey. It pushes teams to align marketing messages with sales conversations, ensuring a seamless and persuasive experience for every prospect.
How to Optimize Your Lead Conversion Rate
Improving your conversion rate is about refining your process to guide leads more efficiently toward becoming customers. Here are actionable strategies to enhance performance and improve your lead management:
- Define Funnel Stages Clearly: Establish explicit, universally understood criteria for what constitutes a Marketing Qualified Lead (MQL), a Sales Accepted Lead (SAL), and a Sales Qualified Lead (SQL). This ensures lead qualification measurement consistency.
- Implement Lead Scoring: Prioritize high-intent prospects by assigning scores based on their demographic data and on-site behavior. This allows your sales team to focus their energy on leads most likely to convert.
- Track Stage-by-Stage Conversions: Monitor conversion rates at each step of the funnel (e.g., from MQL to SQL). This helps pinpoint specific bottlenecks where leads are dropping off, so you can address the root cause.
- A/B Test Relentlessly: Continuously test landing pages, email copy, calls-to-action (CTAs), and offers. Small, iterative improvements can compound over time to significantly boost your overall conversion rate.
3. Marketing Qualified Leads (MQL) to Sales Qualified Leads (SQL) Ratio
The MQL to SQL ratio is one of the most vital lead generation key performance indicators for measuring the alignment between marketing and sales. It calculates the percentage of marketing-generated leads that are deemed qualified enough to be passed to the sales team for direct engagement. This KPI offers a clear lens into the quality of leads your marketing efforts are generating.
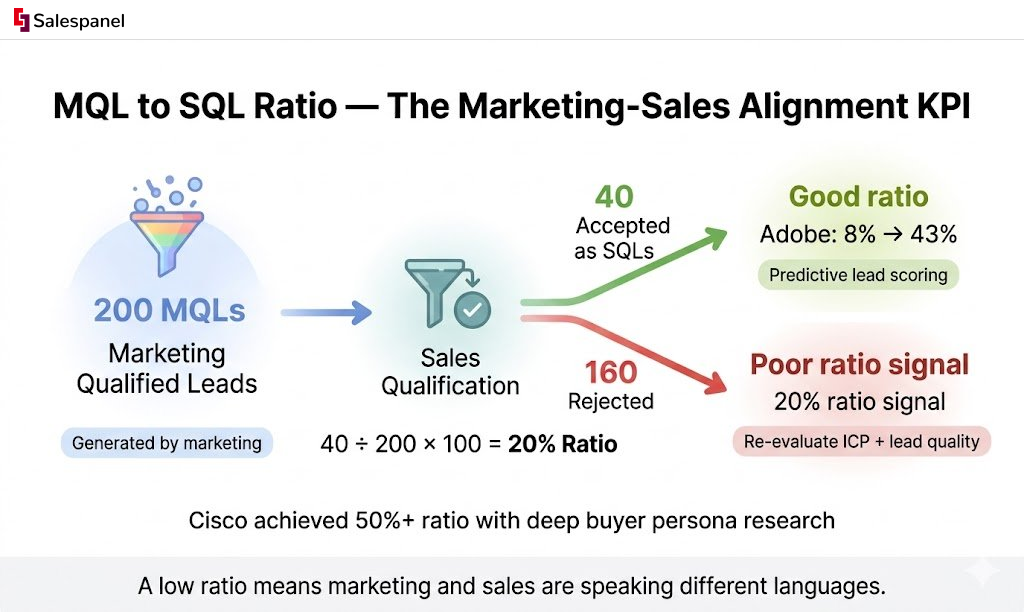
The formula is: (Total Sales Qualified Leads ÷ Total Marketing Qualified Leads) x 100 = MQL to SQL Ratio. This metric is crucial because it diagnoses the health of your marketing-to-sales handoff. A low ratio signals a disconnect, where marketing is generating leads that sales consistently rejects, wasting resources and creating friction. For example, if marketing generates 200 MQLs and sales accepts only 40 as SQLs, the ratio is 20%—a signal to re-evaluate your ICP and lead quality criteria.
Why the MQL to SQL Ratio is a Critical KPI
Tracking the MQL to SQL ratio is essential for validating lead quality and ensuring marketing efforts directly contribute to revenue opportunities. For instance, Adobe dramatically improved its MQL to SQL conversion from a mere 8% to an impressive 43% by implementing predictive lead scoring, ensuring only the highest-potential leads reached their sales team. Similarly, Cisco Systems elevated its ratio to over 50% by investing in deep buyer persona research and creating highly targeted content that attracted more qualified prospects from the start.
This KPI moves beyond lead volume to focus on lead value. It forces a shared definition of a “good lead” between departments, which is the bedrock of a successful revenue engine. Without this metric, marketing may focus on quantity over quality, flooding the sales team with unqualified prospects and eroding trust.
How to Optimize Your MQL to SQL Ratio
Improving your MQL to SQL conversion rate is a direct path to a more efficient and productive sales pipeline. Here are actionable tips to enhance this crucial metric:
- Establish a Service Level Agreement (SLA): Formally document the definitions of an MQL and an SQL with input from both marketing and sales. This SLA should create clear, agreed-upon criteria for when a lead is passed over.
- Implement Robust Lead Scoring: Use a lead scoring system that combines demographic, firmographic, and behavioral data. This ensures leads are judged on both their profile fit and their engagement level, prioritizing those who are genuinely ready for a sales conversation.
- Create a Feedback Loop: Systematically track the reasons why sales rejects MQLs. Analyze this data to identify patterns, such as leads from a specific campaign being consistently unqualified, and use these insights to refine your targeting and messaging.
- Regularly Refine Criteria: Don’t let your qualification criteria become static. Review and update your MQL and SQL definitions quarterly, incorporating insights from closed-won and closed-lost deals to continuously align with what defines a successful customer.
4. Lead Response Time
Lead Response Time measures the elapsed time between a lead submitting their information and when they receive a meaningful response from your sales team. In an era of instant gratification, speed is a paramount factor in successful conversion. This metric is a direct indicator of your sales team’s efficiency and your company’s commitment to engaging potential customers when their interest is at its peak.
The formula is a simple time calculation: Time of First Meaningful Response – Time of Lead Submission = Lead Response Time. This is one of the most critical lead generation key performance indicators because it directly correlates with conversion rates. A slow response doesn’t just frustrate a potential buyer; it gives your competitors an opportunity to engage them first.
Why Lead Response Time is a Critical KPI
Tracking Lead Response Time reveals potential bottlenecks in your sales process and highlights the urgency required in modern sales. Landmark research from InsideSales.com (now XANT) found that leads contacted within five minutes are 21 times more likely to convert than those contacted after 30 minutes. A practical validation of this principle is how the conversational marketing platform Drift reduced its own response time to under one minute using chatbots, which contributed to a staggering 191% increase in conversions.
This KPI forces a shift from passive lead management to proactive engagement. It underscores that the value of a lead decays rapidly, and a swift, personalized follow-up is essential to capitalize on the initial moment of interest and capture momentum before it is lost.
How to Optimize Your Lead Response Time
Improving your Lead Response Time requires a combination of technology, process, and team alignment. Here are actionable tips to reduce your response times and boost conversions:
- Implement Lead Routing Automation: Use your CRM or marketing automation platform to instantly assign new leads to the correct salesperson based on territory, industry, or other criteria. This eliminates manual delays.
- Leverage Chatbots and Auto-responders: Use chatbots for 24/7 immediate engagement on your website. At a minimum, set up an automated email to acknowledge receipt of a form submission while a sales rep prepares a personalized response.
- Enable Mobile CRM Access: Equip your sales team with mobile CRM apps so they can receive real-time lead alerts and respond from anywhere, not just when they are at their desks.
- Establish a “Five-Minute Rule”: Make it a core team goal to respond to all inbound leads within five minutes. Track this metric and use it as a key performance indicator for your sales development representatives (SDRs).
5. Lead Quality Score
Lead Quality Score is a predictive metric used to rank prospects on a scale representing their perceived value to your business. This score is calculated by assigning numerical values to leads based on a wide range of attributes, including demographic information, firmographics (like company size or industry), and behavioral signals such as website engagement and email interactions. This system helps prioritize leads that are most likely to convert, allowing sales teams to focus their efforts efficiently.
The formula is a weighted sum: (Demographic Score x Weight) + (Firmographic Score x Weight) + (Behavioral Score x Weight) = Lead Score. This KPI is a cornerstone of modern lead management because it bridges the gap between marketing volume and sales value. Instead of treating all leads equally, lead scoring provides a data-backed hierarchy, ensuring high-potential prospects receive immediate attention while others are nurtured.
Why Lead Quality Score is a Critical KPI
Tracking lead scores is essential for aligning marketing and sales teams and increasing conversion rates. By establishing a clear, agreed-upon definition of a “qualified” lead, you eliminate subjective guesswork and foster collaboration. As a practical example, Lenovo used predictive lead scoring to increase its conversion rates by an impressive 175%, proving the model’s effectiveness in identifying purchase-ready leads. Similarly, Infer (now part of Ignite) helped major tech companies like Adobe and HP achieve a 40% increase in their marketing-sourced pipeline by implementing sophisticated scoring.
This KPI transforms your sales process from reactive to proactive. When a lead reaches a certain score threshold, it can be automatically routed to a sales representative, ensuring timely follow-up when buying intent is at its peak. This automation is a key function in platforms that offer lead scoring, enabling businesses to act on data in real-time.
How to Optimize Your Lead Quality Score
Developing and refining a lead scoring model is an ongoing process that directly impacts sales efficiency. Here are actionable tips to create a powerful scoring system:
- Analyze Closed-Won Deals: Start by interviewing your sales team and analyzing CRM data to identify the common characteristics of your best customers. These attributes become the foundation of your scoring model.
- Balance Fit and Interest: Include both “fit” criteria (demographics and firmographics) and “interest” criteria (behavioral data like page views or downloads). A good fit who shows no interest is not a hot lead.
- Implement Negative Scoring: Assign negative points for disqualifying attributes. For instance, if a lead is a student, a competitor, or from a non-target geography, their score should decrease to prevent them from being prioritized.
- Establish Clear Thresholds: Define specific score ranges that classify leads as cold, warm, Marketing Qualified (MQL), or Sales Qualified (SQL). This creates a clear handoff point between marketing and sales.
- Review and Refine Quarterly: Your ideal customer profile and market can change. Review your scoring model every quarter, analyze conversion data, and adjust point values and criteria to maintain its accuracy and predictive power.
6. Customer Acquisition Cost (CAC)
Customer Acquisition Cost (CAC) is a comprehensive metric that measures the total cost to acquire a new paying customer, not just a lead. It expands on CPL by encompassing all marketing and sales expenses, offering a holistic view of the efficiency and sustainability of your entire growth engine.
The formula is: (Total Marketing Costs + Total Sales Costs) ÷ Number of New Customers Acquired = CAC. This KPI is one of the most vital lead generation key performance indicators for any business, as it connects marketing investment directly to bottom-line revenue and profitability. For example, if a company spends $300,000 on sales and $100,000 on marketing in a quarter and acquires 100 customers, their CAC is $4,000.
Why CAC is a Critical KPI
While CPL measures top-of-funnel efficiency, CAC provides the ultimate verdict on your customer acquisition strategy’s financial health. It forces you to look beyond lead volume and focus on profitable growth. For instance, Shopify maintains a healthy CAC by balancing paid advertising with strong organic and referral channels. This disciplined approach ensures that the cost to acquire a customer remains significantly lower than their lifetime value.
Similarly, Zoom leveraged a product-led growth strategy and a freemium model to drastically lower its CAC. By allowing the product to act as its own marketing engine, the company created a viral loop that attracted millions of users, many of whom converted to paid customers with minimal direct sales and marketing intervention.
How to Optimize Your CAC
Optimizing CAC is about making your entire sales and marketing funnel more efficient, from first touch to final sale. Here are actionable strategies to improve this critical metric:
- Target a 3:1 LTV:CAC Ratio: As a benchmark popularized by SaaS experts like David Skok, aim for a Lifetime Value (LTV) that is at least three times your CAC. An ideal ratio is 4:1 or higher, indicating a highly profitable customer acquisition model.
- Include Fully-Loaded Costs: For an accurate calculation, ensure you include all associated expenses: ad spend, creative production, agency fees, and the salaries, benefits, and software costs for your marketing and sales teams.
- Calculate Channel-Specific CAC: Just as with CPL, calculate CAC for each acquisition channel. This will reveal which channels not only generate leads but also convert them into high-value customers efficiently.
- Reduce Time-to-Purchase: Implement strategies like lead nurturing and marketing automation to shorten the sales cycle. The faster a lead converts to a customer, the lower the associated resource cost, which directly improves your CAC.
7. Lead Source ROI
Lead Source ROI measures the return on investment for each marketing channel by comparing the revenue generated from its leads against the channel’s cost. While metrics like CPL gauge efficiency, this KPI connects marketing activities directly to revenue, revealing which sources drive profitable growth. It is a fundamental metric for data-driven budget allocation.
The formula is: ((Revenue from a Source – Cost of the Source) ÷ Cost of the Source) x 100 = ROI. This powerful KPI moves beyond simple lead volume to evaluate the ultimate business impact of your channels, helping you distinguish between sources that generate many low-value leads and those that deliver fewer, but highly profitable, customers. A practical example: spending $10,000 on Google Ads that generates $50,000 in customer revenue yields a 400% ROI.
Why Lead Source ROI is a Critical KPI
Tracking ROI by source is essential for strategic marketing investment. It allows you to double down on high-performing channels while re-evaluating or optimizing underperforming ones. For instance, CoSchedule discovered that their organic blog content produced a 14x better ROI than paid advertising, prompting a significant strategic shift toward content marketing. Similarly, Intercom found that a product-led growth motion using free trials delivered a 5x better ROI than their traditional sales-led approach, fundamentally changing their go-to-market strategy.
These examples show how focusing on this lead generation key performance indicator can reshape an entire marketing budget for maximum impact, ensuring every dollar is invested where it generates the most revenue.
How to Optimize Your Lead Source ROI
Improving ROI requires a granular and strategic approach to tracking and analysis. Here are actionable tips to maximize the return from your marketing channels:
- Implement Robust Tracking: Use UTM parameters for all digital campaigns to accurately attribute website traffic and conversions back to their origin in your analytics or CRM.
- Use Marketing Attribution Software: To understand complex customer journeys, use multi-touch attribution models (e.g., linear, U-shaped, time-decay) to assign credit appropriately across all touchpoints, not just the first or last one.
- Calculate Full Costs: Include all direct costs (ad spend, agency fees) and allocated overhead (salaries, software subscriptions) in your source cost calculations for an accurate ROI figure.
- Analyze and Reallocate: Review source performance quarterly. Reallocate budget from low-ROI channels to your top performers to amplify results and drive more profitable growth.
8. Lead Velocity Rate (LVR)
Lead Velocity Rate (LVR) measures the month-over-month growth of qualified leads entering your sales pipeline. Unlike static lead counts, LVR is a crucial forward-looking indicator that predicts future revenue growth. Popularized by SaaS thought leaders like Jason Lemkin of SaaStr, it offers an early warning system for your pipeline’s health.
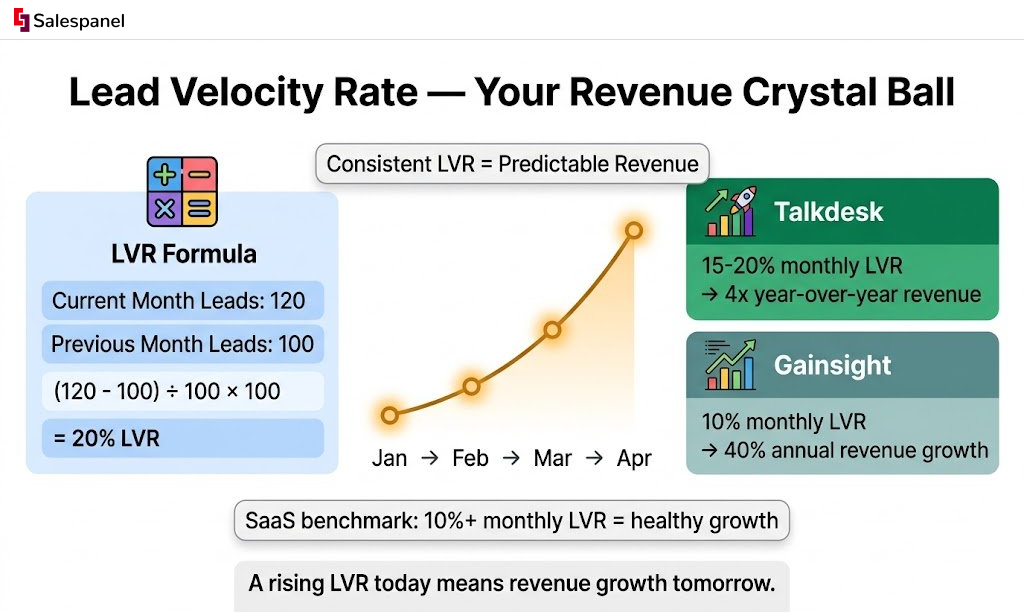
The formula is: ((Current Month’s Qualified Leads – Previous Month’s Qualified Leads) ÷ Previous Month’s Qualified Leads) x 100 = LVR %. This KPI is invaluable because it gauges momentum. A positive LVR signifies an accelerating marketing engine, while a dip can signal future revenue shortfalls long before they impact the bottom line. If you generated 100 qualified leads last month and 120 this month, your LVR is 20%.
Why LVR is a Critical KPI
Tracking LVR provides a real-time pulse on your business’s growth trajectory. For subscription-based companies, it is one of the most powerful lead generation key performance indicators because it directly correlates to future recurring revenue. For a practical validation, consider how Talkdesk famously maintained a 15-20% monthly LVR for three consecutive years, which allowed it to predictably achieve 4x year-over-year revenue growth. This demonstrates LVR’s power to forecast and sustain rapid expansion.
Similarly, Gainsight uses LVR as a primary marketing success metric, having established a clear correlation where a consistent 10% monthly LVR leads to approximately 40% annual revenue growth. This transforms marketing from a cost center into a predictable revenue driver, aligning the entire organization around a single, powerful growth metric.
How to Optimize Your LVR
Sustaining a healthy LVR is key to achieving predictable, scalable growth. Here are actionable tips to accelerate your qualified lead growth:
- Set a Growth Target: For SaaS businesses, a minimum of 10% monthly LVR is a common benchmark for healthy growth. Aiming for this target keeps your team focused on consistent expansion.
- Segment by Source: Track LVR for each lead source (e.g., organic search, paid ads, referrals) independently. This will highlight which channels are accelerating your growth and which are stagnating, allowing for smarter budget allocation.
- Forecast Hiring Needs: Use LVR trends to predict future staffing requirements for your sales and customer success teams. A rising LVR today means you’ll need more sales development representatives (SDRs) and account executives in the next one to two quarters.
- Investigate Dips Immediately: A decline in LVR is a leading indicator of future revenue problems. Treat any significant dip as an urgent issue to investigate, whether it’s due to campaign performance, seasonality, or market shifts.
Lead Generation KPI Comparison Table
| Metric | Implementation Complexity | Resource Requirements | Expected Outcomes | Ideal Use Cases | Key Advantages |
|---|---|---|---|---|---|
| Cost Per Lead (CPL) | Low – simple calculation | Basic tracking tools, marketing spend data | Measures cost efficiency of lead generation | Budgeting, channel cost comparison | Easy to calculate, benchmarks marketing efficiency |
| Lead Conversion Rate | Medium – requires multi-stage tracking | CRM, sales and marketing alignment | Measures lead quality and sales effectiveness | Optimizing sales funnel stages | Reveals funnel effectiveness, aids revenue forecasting |
| MQL to SQL Ratio | Medium – needs clear MQL/SQL definitions | Collaboration between marketing & sales | Evaluates lead quality and alignment | Marketing-sales handoff optimization | Improves collaboration, reduces unqualified leads |
| Lead Response Time | Medium – tracking response timestamps | CRM automation, staffing for responsiveness | Higher conversion with faster responses | Sales responsiveness and customer experience | Strong conversion impact, competitive advantage |
| Lead Quality Score | High – complex scoring models | Historical data, AI/machine learning | Prioritizes highest-potential leads | Lead prioritization and nurturing | Improves sales productivity, reduces subjectivity |
| Customer Acquisition Cost (CAC) | High – comprehensive cost tracking | Detailed sales and marketing data | Evaluates overall acquisition efficiency | Business profitability and pricing strategy | Complete acquisition cost insight for budgeting & ROI |
| Lead Source ROI | High – requires sophisticated attribution | Multi-touch tracking systems | Connects marketing channels to revenue | Marketing budget allocation and optimization | Direct revenue connection, reduces wasteful spend |
| Lead Velocity Rate (LVR) | Medium – consistent lead qualification | Regular lead data, alignment on criteria | Predicts future revenue growth | Subscription & SaaS growth forecasting | Forward-looking metric, aligns teams on growth |
From Data Points to Decisions: Activating Your KPI Framework
Navigating the landscape of lead generation is no longer about casting a wide net; it’s about precision engineering. We’ve dissected eight critical lead generation key performance indicators, from the financial guardrails of Cost Per Lead (CPL) and Customer Acquisition Cost (CAC) to the operational heartbeat of Lead Response Time and Lead Velocity Rate. Each metric is more than a number on a dashboard; it’s a diagnostic tool, a lever for strategic action that connects marketing spend directly to revenue growth.
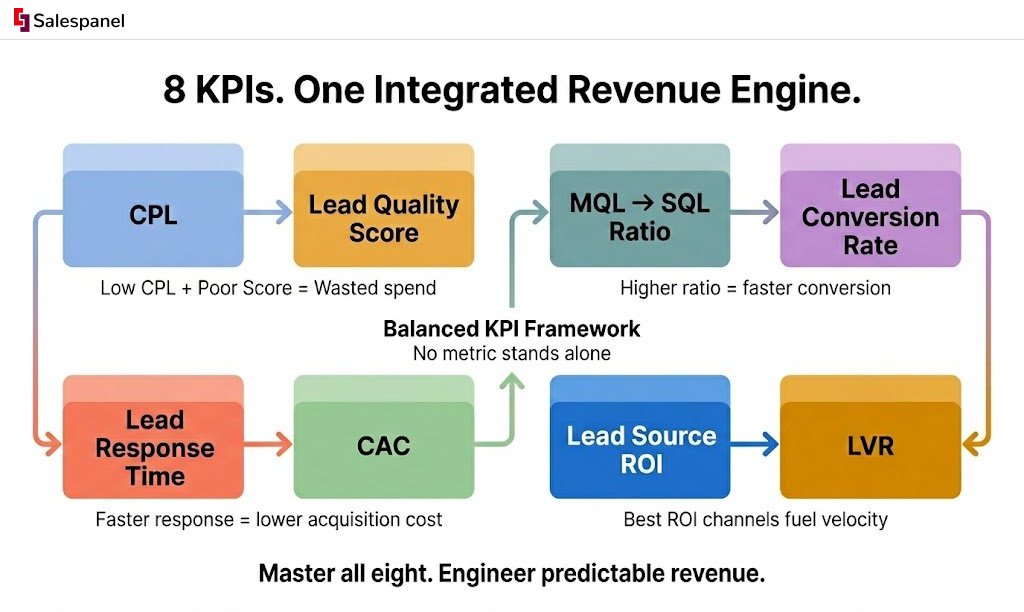
The central theme we’ve pursued is the transition from passive measurement to active, data-driven management. Your most significant takeaway should be the understanding that these KPIs are deeply interconnected. A low CPL is a hollow victory if it results in a dismal Lead Quality Score. Likewise, a high Lead Velocity Rate is unsustainable if your CAC skyrockets. True mastery lies in creating a balanced, integrated framework where these metrics inform one another, painting a complete picture of your pipeline’s health and efficiency.
Activating Your Insights: The Path Forward
The real work begins now. Transforming this knowledge into a competitive advantage requires a commitment to a unified data infrastructure and a culture of continuous optimization. Simply tracking these KPIs is not enough; you must empower your team to act on the insights they provide.
Here are your actionable next steps:
- Build a Unified Dashboard: Consolidate the eight KPIs into a single, accessible dashboard. This central hub becomes your team’s source of truth, eliminating data silos and enabling holistic decision-making. Review this dashboard weekly in cross-functional meetings with both marketing and sales.
- Establish a Rhythm of Review and Response: Don’t let data become stale. Implement a weekly or bi-weekly cadence to analyze KPI trends. If your MQL-to-SQL ratio drops, investigate immediately. If a specific channel’s lead source ROI is declining, re-allocate your budget with agility.
- Leverage a Consolidated Data Foundation: The accuracy of every KPI hinges on the quality of your underlying data. By using advanced tracking mechanisms and collecting first-party data, you ensure that metrics like Lead Conversion Rate and CAC are calculated from a clean, comprehensive dataset.
- Automate for Precision and Speed: Manual processes are the enemy of efficiency. Implement technology to automate where it matters most. Using a lead scoring framework can automatically qualify leads based on behavior and firmographics, directly improving your Lead Quality Score and MQL-to-SQL ratio, allowing your sales team to engage the best prospects faster.
Ultimately, mastering these lead generation key performance indicators is about shifting your organization’s mindset. It’s about moving beyond vanity metrics to focus on the tangible drivers of pipeline growth and revenue. By adopting this integrated and actionable approach, you’re not just tracking performance; you’re systematically engineering a more predictable, scalable, and profitable growth engine for your business.
Ready to transform your data into a revenue-driving machine? Discover how Salespanel can unify your tracking, automate lead scoring, and provide the crystal-clear KPI visibility you need to grow with confidence. Explore our resources to see how you can activate your lead generation framework today.