Marketing measurement has evolved from an art of approximation to a science of precision. In the past, marketers operated in a fog, relying on metrics like direct mail response rates that hovered around a dismal 2-5% and offered little insight into the customer journey. The digital revolution promised clarity but often delivered a deluge of data without context, trapping teams in a cycle of chasing vanity metrics—likes, shares, and impressions—that looked impressive but failed to impact the bottom line. A 2023 study found that while 72% of marketers prioritize revenue-centric metrics, a significant portion still struggle to connect their efforts directly to financial outcomes. This guide provides a definitive framework to bridge that gap. It moves beyond correlation to establish causation, providing the technical knowledge to prove that your campaigns are not just active, but effective revenue drivers.
Moving Beyond Likes And Shares
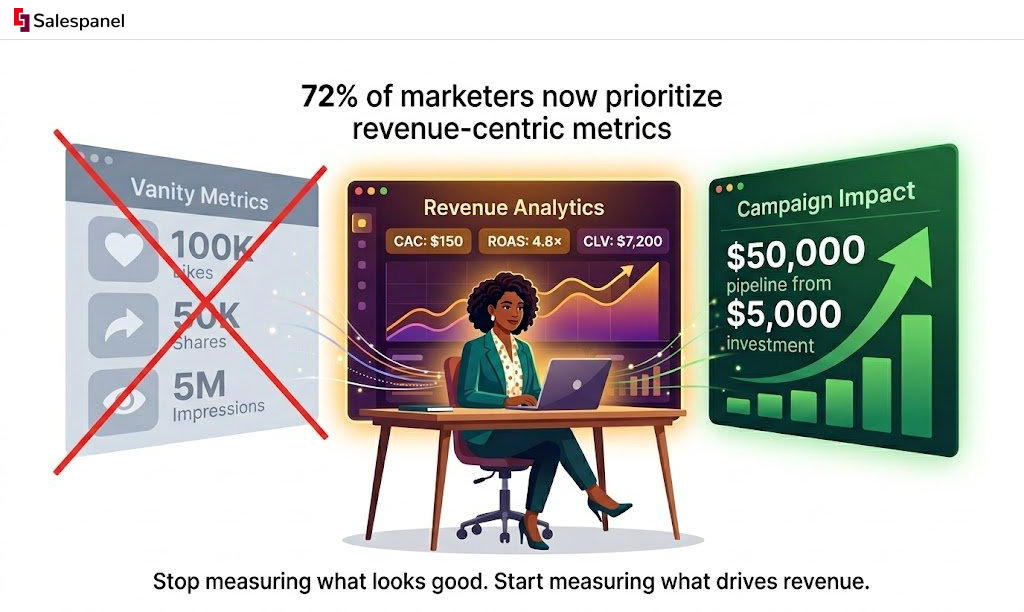
The central theme of modern marketing measurement is the shift from guesswork to data-driven growth. It is no longer sufficient to observe that “sales went up after we launched that campaign.” The contemporary imperative is to scientifically prove the campaign caused the increase. This transition is non-negotiable for any organization seeking to optimize its marketing spend and demonstrate tangible value.
The Shift from Guesswork to Growth
This fundamental change in approach is driven by critical business needs. A precise, technical methodology for measurement allows marketing teams to operate not as a cost center, but as a documented revenue engine.
- Secure Bigger Budgets: When you can trace every marketing dollar back to a revenue outcome, budget discussions transform. You are no longer asking for resources based on projections; you are presenting a data-backed business case for investment with a predictable return.
- Drive Real Growth: Precise measurement illuminates which strategies and channels deliver results. This analytical clarity enables teams to divest from underperforming tactics and double down on high-impact activities, accelerating growth efficiently.
- Demonstrate Your Value: In an environment of fiscal scrutiny, the ability to quantify marketing’s contribution to the bottom line is paramount. It solidifies the marketing function’s role as a critical component of the company’s financial success.
The core challenge for modern marketers is to build a direct, undeniable line from campaign activity to customer acquisition and revenue. Anything less is just noise.
A Framework for True Effectiveness
Attaining this level of precision requires more than a single “magic metric.” It demands a robust framework that systematically connects day-to-day marketing actions to measurable business results. This guide will deconstruct the technical components of such a framework, equipping you with the tools and strategies to build campaigns that are undeniably effective.
For a broader look at the core principles behind understanding a campaign’s true impact, check out these proven strategies for measuring marketing campaign effectiveness. Grasping these fundamentals will provide a solid foundation for the technical deep dives that follow, from setting clear goals to isolating your campaign’s true impact.
Setting Goals That Actually Drive Business Value
Effective measurement does not begin when a campaign is launched; it begins with a rigorous, technical definition of success. Without clear, business-oriented objectives, any measurement effort is meaningless. You cannot measure what you have not defined.
This foundational step requires translating high-level business goals, such as increasing market share, into granular Key Performance Indicators (KPIs) like Cost Per Lead (CPL) that can be tracked daily. A structured approach is essential to prevent teams from chasing vanity metrics that feel productive but fail to impact what truly matters to the organization.
The Metrics Pyramid Framework
A powerful methodology for structuring this process is the “metrics pyramid.” This framework organizes metrics into hierarchical tiers, ensuring strategic alignment from the executive suite to the operational team.
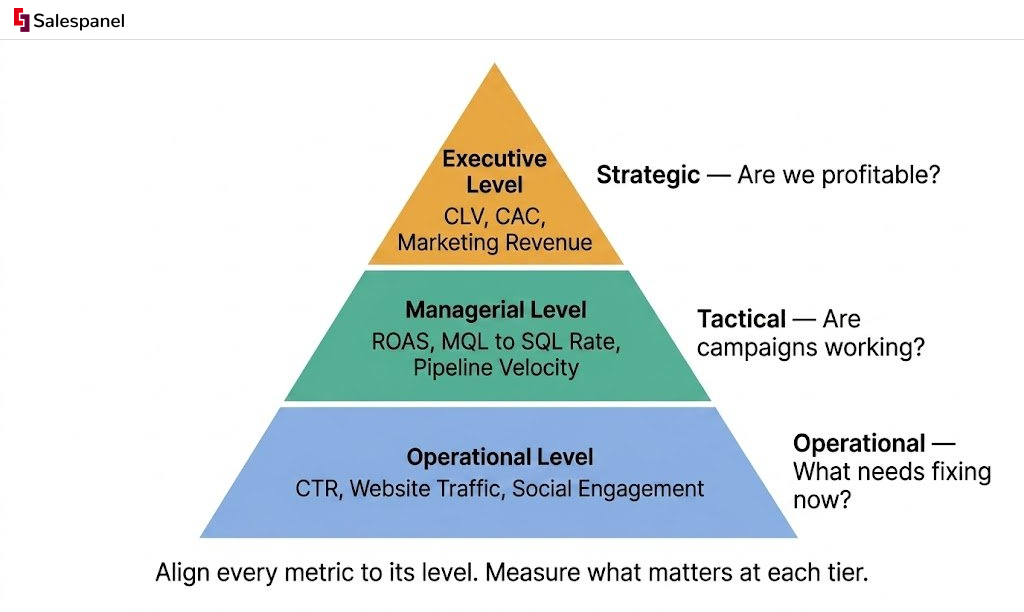
- Executive Level (Top): This tier focuses exclusively on big-picture financial metrics that directly impact the company’s P&L statement. Key metrics include Customer Lifetime Value (CLV), Customer Acquisition Cost (CAC), and overall marketing-generated revenue.
- Managerial Level (Middle): Here, marketing managers track campaign-specific KPIs that link daily activities to top-tier goals. This is where you find metrics such as Return on Ad Spend (ROAS), lead-to-customer conversion rate, and pipeline velocity. For example, a manager might monitor the MQL-to-SQL conversion rate to ensure lead generation efforts are producing sales-ready prospects.
- Operational Level (Base): At the foundation, the execution team monitors real-time, channel-specific statistics that inform tactical adjustments. These include click-through rates (CTR), website traffic sources, and social media engagement rates. A sudden drop in CTR on a specific ad set would trigger an immediate operational response, such as testing new ad creative.
This structured alignment is crucial. A B2B SaaS company, for instance, might prioritize lowering its CAC to achieve profitability targets, while a direct-to-consumer e-commerce brand will be hyper-focused on ROAS to ensure immediate profitability on ad spend.
Matching Campaign Goals to Core KPIs
To implement this framework practically, you must explicitly map campaign objectives to specific KPIs. Different goals demand different measurement criteria.
| Campaign Objective | Primary KPI | Secondary Metrics |
|---|---|---|
| Brand Awareness | Reach & Impressions | Social Media Engagement, Website Traffic, Share of Voice |
| Lead Generation | Cost Per Lead (CPL) | Conversion Rate, Leads by Source, MQL-to-SQL Rate |
| Customer Acquisition | Customer Acquisition Cost (CAC) | Lead-to-Customer Rate, Conversion Value |
| Sales & Revenue | Return on Ad Spend (ROAS) | Average Order Value (AOV), Total Revenue Generated |
| Customer Retention | Customer Lifetime Value (CLV) | Churn Rate, Repeat Purchase Rate, Net Promoter Score (NPS) |
Using a matrix like this forces strategic discipline. It ensures that the metrics being tracked are not chosen for convenience but because they are the most accurate indicators of success for a specific campaign objective. This is the essence of purposeful measurement.
Prioritizing Revenue-Centric Metrics
Modern marketing teams operate under intense pressure to demonstrate financial contribution. A 2023 study confirmed this trend, revealing that over 72% of global marketing teams now prioritize metrics directly tied to revenue, such as CAC and ROAS. Leading companies utilize multi-level metric frameworks to ensure universal alignment, significantly mitigating the risk of budget cuts by clearly articulating their business value.
For practical application, knowing that the average CAC in retail ranges from $45 to $150 per customer provides an external benchmark to set realistic and competitive performance targets. You can dive deeper into the numbers in this in-depth analysis of global marketing metrics.
The most effective campaign goals are not just SMART (Specific, Measurable, Achievable, Relevant, Time-bound); they are directly tethered to a financial outcome. Every goal should ultimately answer the question: “How will this drive revenue or reduce costs?”
Adopting this business-first mindset fundamentally changes the marketing narrative. The conversation shifts from “we got 10,000 clicks” to “we generated $50,000 in sales pipeline from a $5,000 investment.” This is the language of business impact, providing a rock-solid benchmark for measuring true effectiveness.
Building Your Modern Measurement Toolkit
With objectives defined, the next phase is to assemble the technical infrastructure for measurement. The choice of technology is not a peripheral concern; it is a strategic decision that dictates the depth and accuracy of your insights. Without the correct tools, even the most well-defined goals are merely untrackable aspirations.
The foundational layer is well-established. A tool like Google Analytics remains essential for understanding website traffic, user behavior, and conversion funnels. When integrated with a robust CRM, it allows you to connect initial web interactions to downstream sales activities.
However, a modern toolkit must penetrate deeper to solve the complex puzzle of marketing attribution.
Understanding and Choosing an Attribution Model
Attribution is the technical process of assigning credit to the marketing touchpoints that influence a conversion. The selected model fundamentally alters your perception of channel effectiveness, thereby dictating budget allocation and optimization priorities. There is no universally “best” model; the optimal choice depends on your business’s sales cycle and strategic objectives.
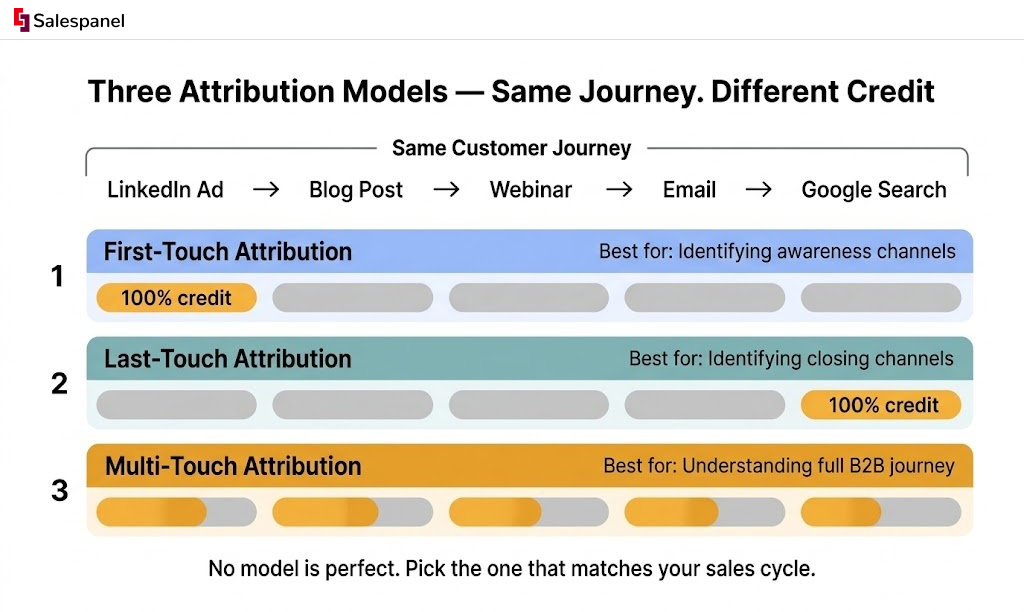
- First-Touch Attribution: This model assigns 100% of the credit to the initial interaction a customer has with your brand. It is highly effective for identifying top-of-funnel channels that are successful at generating initial awareness and demand. For example, if a user’s first contact is a LinkedIn ad and they convert a month later, that ad receives full credit.
- Last-Touch Attribution: In contrast, this model attributes 100% of the credit to the final touchpoint before a conversion. It excels at identifying which channels are most effective at “closing” the deal. For instance, if a user clicks a Google search ad and immediately makes a purchase, that search ad is credited, regardless of prior interactions.
- Multi-Touch Attribution: This approach provides a more realistic view by distributing credit across multiple touchpoints. Models like Linear (equal credit to all touches) or Time Decay (more credit to recent touches) offer a more nuanced understanding of the customer journey. This is indispensable for B2B companies with long sales cycles, where a prospect may engage with a blog post, a webinar, and an email marketing campaign over several weeks before converting.
The Power of Integrated, First-Party Data
The efficacy of any attribution model is contingent upon a complete, unified view of the customer journey. This is where your own first-party data becomes a critical strategic asset. A disconnected technology stack is incapable of capturing this holistic view; an integrated system is required.
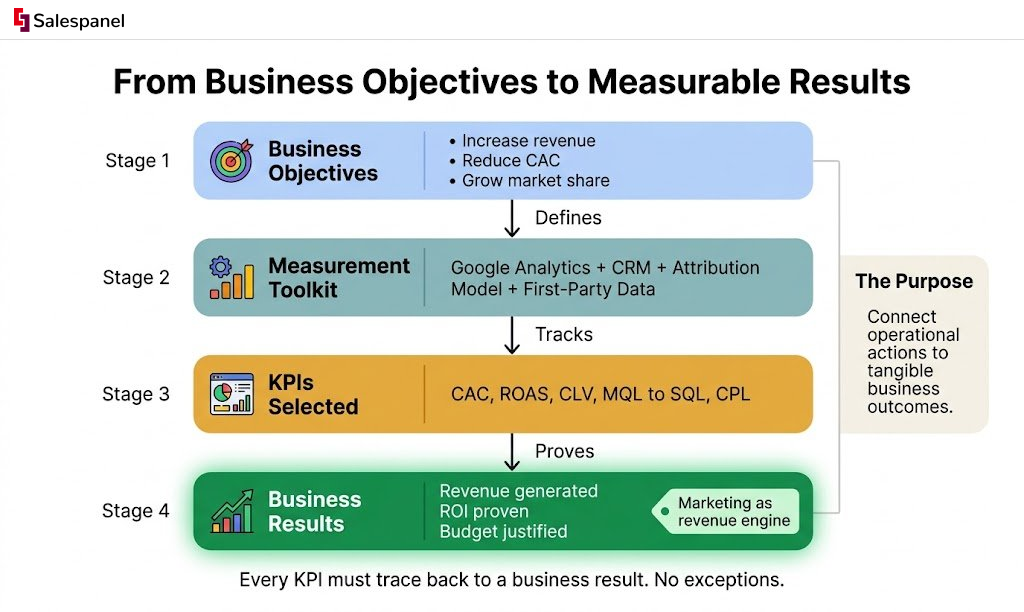
This visualization illustrates the necessary flow—from setting high-level business objectives down to selecting the specific KPIs that prove value creation. As the infographic shows, the purpose of your toolkit is to connect specific operational actions (KPIs) to tangible business results.
This is where specialized platforms provide a distinct advantage. Consider website visitor tracking from Salespanel. This technology allows you to map the complete journey of every website visitor, both known and anonymous. By unifying this behavioral data, you begin to collect the granular, first-party insights necessary to power an accurate attribution model and truly understand conversion drivers.
Isolating Your Campaign’s True Impact
Your campaign is live, and sales have increased. This is a positive correlation, but it is not proof of causation. The critical task for the technical marketer is to determine whether the campaign caused the sales lift or merely coincided with external factors like seasonality or a competitor’s misstep.
Moving beyond intuition requires adopting a scientific methodology. Leading organizations do not guess; they use controlled methods to prove that marketing spend is directly responsible for growth. This is how you transition from making assumptions to making surgically precise budgetary decisions.
The Gold Standard: Randomized Controlled Trials
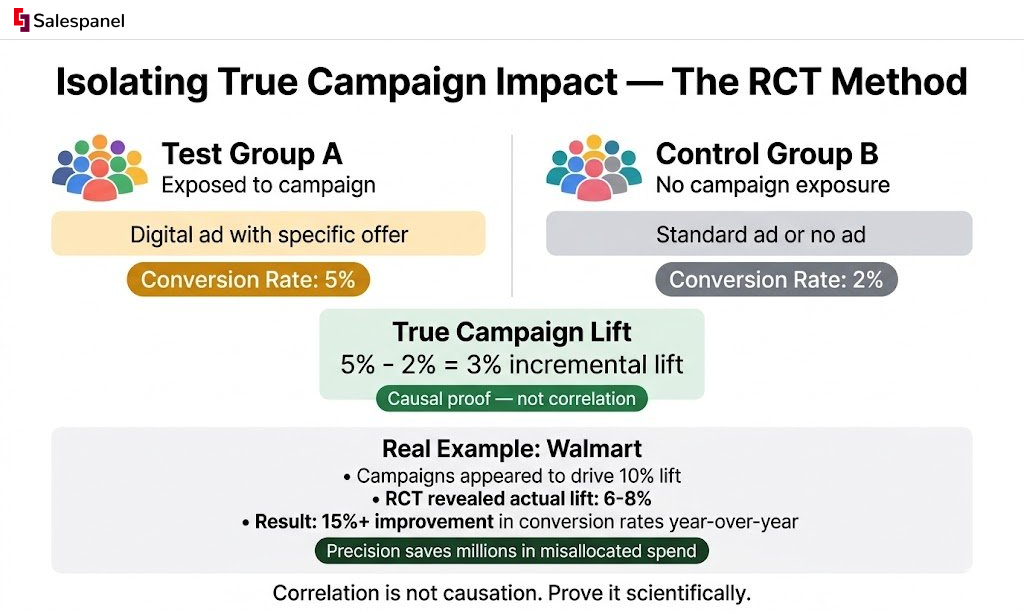
The most rigorous method for isolating impact is the Randomized Controlled Trial (RCT), commonly known in marketing as A/B testing. Its power lies in its scientific simplicity. You divide a target audience into two statistically identical groups and manipulate a single variable.
- Test Group (Group A): This cohort is exposed to the marketing campaign, such as a digital ad with a specific offer.
- Control Group (Group B): This cohort is intentionally held out, receiving a standard ad or no ad at all, thus serving as a scientific baseline.
By comparing the outcomes, you can precisely measure the campaign’s effect. If the test group converted at 5% and the control group at 2%, the 3% differential represents the true, causal lift attributable to your campaign. This eliminates confounding variables and provides definitive proof.
This is not an academic exercise; it has a significant bottom-line impact. Walmart, for example, employs sophisticated RCTs to measure marketing effectiveness. Through this method, they discovered that campaigns appearing to drive a 10% sales lift were, in reality, only causing a 6-8% incremental increase. This precision has enabled them to improve digital campaign conversion rates by over 15% year-over-year.
Powerful Alternatives When RCTs Aren’t Practical
Executing a perfect RCT is not always feasible due to constraints in audience size, technology, or the nature of the campaign (e.g., a national TV broadcast). In such cases, robust statistical methods can provide a close approximation of causal impact.
The goal is to get as close to causal proof as possible. While an RCT is ideal, a well-executed statistical model is far more reliable than simply looking at before-and-after trends.
One of the most effective techniques is Difference-in-Differences (DiD). This quasi-experimental method compares the change in an outcome over time between a group exposed to the campaign and one that was not. DiD effectively controls for underlying trends that would have occurred regardless of the campaign, providing a cleaner measurement of its true effect.
Ultimately, moving beyond surface-level metrics to isolate true impact requires a deep understanding of how to measure marketing ROI with technical discipline. By embracing these scientific methods, you are not merely reporting numbers—you are building an evidence-based case for your strategies and ensuring optimal allocation of every marketing dollar.
Turning Measurement Into Smarter Decisions
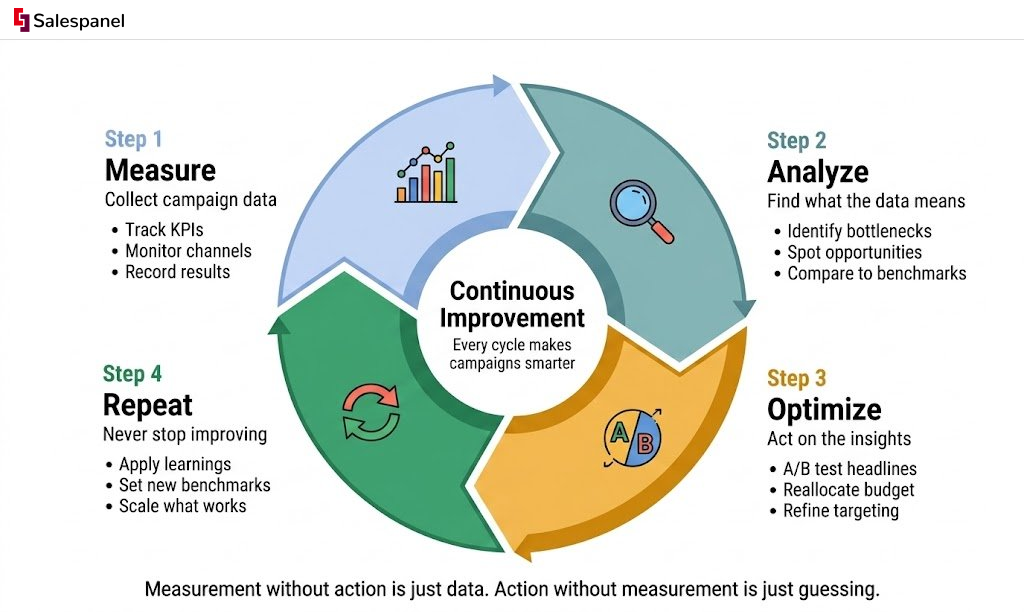
You have collected the data. The crucial final step is to translate this data into action. Raw numbers are inert; their value is only realized when they inform strategic decisions. The process must be a continuous feedback loop: Measure, Analyze, Optimize, Repeat. This is the engine of iterative improvement, where insights from your measurement toolkit directly inform the next tactical move.
From Insights To Actionable Optimization
The optimization process must be swift and decisive. When data signals an issue, the response should be immediate and testable.
- Practical Example: You observe a high bounce rate on a newly launched landing page via your analytics platform. Instead of waiting for a weekly review, you immediately launch an A/B test comparing the existing headline against a new, benefit-oriented variant. Within 48 hours, you have data indicating which version performs better, allowing for a rapid, data-informed optimization.
- Practical Example: An ad set in your PPC campaign shows a declining click-through rate (CTR) and rising cost-per-click (CPC). This data is an immediate signal to test new ad creative, refine audience targeting parameters, or adjust ad copy to better match user search intent.
This is also the critical juncture for aligning marketing activities with sales outcomes. The goal is not merely to generate a high volume of leads, but to generate leads that the sales team can convert into revenue.
Effective measurement doesn’t just tell you what happened; it points you to what to do next. It’s the bridge between past performance and future strategy.
Connecting Marketing Efforts to Sales Success
The ultimate validation of a marketing campaign is its impact on revenue. This necessitates a seamless alignment between marketing-generated leads and sales conversion rates. A common point of failure is a disconnect where marketing celebrates a high lead volume while the sales team struggles with low-quality prospects.
To solve this, a technical system is needed to qualify leads based on firmographic, demographic, and behavioral data. For example, the lead scoring framework from Salespanel automates this process. It analyzes a prospect’s website activity (e.g., visited pricing page, downloaded a whitepaper) and company data to assign a numerical score, algorithmically identifying which leads are sales-ready.
This ensures marketing delivers high-value opportunities, making the entire revenue operation more efficient and providing undeniable proof of your campaign’s direct contribution to the bottom line.
Got Questions? We’ve Got Answers
Applying these technical frameworks to real-world campaigns can generate specific questions. Here are answers to some of the most common inquiries from marketers.
What’s the Real Difference Between Marketing Metrics and KPIs?
This distinction is fundamental. A marketing metric is any quantifiable data point: website visitors, email open rates, social media likes. These are diagnostic indicators.
A Key Performance Indicator (KPI), however, is a specific metric chosen for its direct correlation to a core business objective. It is a measure of strategic progress.
For example, ‘website traffic’ is a metric. But ‘qualified leads generated from organic search traffic’ is a KPI because it is directly tied to the business goal of revenue generation. KPIs answer the strategic question, “Are we succeeding in our objectives?” while metrics provide the tactical context to understand why.
How Often Should I Be Checking My Campaign Performance?
The required monitoring frequency is dictated by the campaign’s channel and velocity.
For high-velocity channels like a PPC campaign on Google Ads, daily or weekly analysis is mandatory. Budgets can be depleted rapidly, and real-time adjustments to bids, keywords, and creative are essential for maximizing return on investment.
Conversely, for longer-term strategies such as SEO or content marketing, a monthly or quarterly review cadence is more appropriate. These channels build momentum over time, and analysis should focus on identifying significant trends rather than reacting to short-term fluctuations.
Regardless of the campaign, a comprehensive post-mortem analysis is non-negotiable. This involves measuring final results against initial objectives and, critically, documenting key learnings to inform future campaigns.
What’s the Biggest Mistake People Make in Campaign Measurement?
The most prevalent and costly error is focusing on vanity metrics. These include impressions, likes, and even un-contextualized clicks.
While they may appear impressive in a high-level report, they provide no evidence of business impact. They are analytically empty. The focus must be on metrics with a direct link to financial outcomes, such as Customer Acquisition Cost (CAC), revenue generated, and Customer Lifetime Value (LTV).
The best marketers I know are relentless. They connect every single activity to a tangible business outcome. It’s the only way to truly prove your ROI and get the budget you need to keep growing.
Shifting your measurement framework to prioritize metrics that directly correlate with revenue is the single most important change you can make. It will fundamentally alter how you strategize, execute, and evaluate your campaigns, and it is the key to proving your value to the C-suite.
At Salespanel, our philosophy is that effective marketing measurement begins with a complete, unified view of customer journey touchpoints. Our platform is engineered to connect every touchpoint to a real business outcome, providing the analytical clarity needed to make smarter, data-driven decisions. Dig into our resources to learn more about building a marketing strategy that truly works at https://salespanel.io/resources.