Conversion Rates by Industry: Benchmarks, Trends & How You Compare (2026 Guide)
The average website conversion rate across the world of digital marketing has remained the same for several years at 2.35%. However, the top-performing companies in the industry report conversion rates of 5.31% and more, effectively doubling their profit with the same amount of traffic. In the years to come, we will see an ever-wider chasm between the average and the top performers, primarily due to smarter data utilization and hyper-personalization. The questions you should be asking are no longer, “What’s my conversion rate?” but “What’s my conversion rate within the specific economic and psychological context of my industry?”

It is highly ineffective to simply chase a universal average. What might be considered a great result in the high-consideration B2B software space will be considered a catastrophe in the fast-moving consumer e-commerce brand. The fine details of the sales cycle length, product cost, market saturation, and the level of trust required to secure a customer will define the result. In this context, the guide pivots away from high-level generic conversion statistics and provides a journalistic, in-depth analysis of industry-specific conversion benchmarks. It will help you set your goals, close the gaps in your performance, and engineer a data-driven path to growth
Understanding the “why” behind the numbers allows you to transform industry benchmarks from a report card into a playbook for optimization.
What a Conversion Really Means for Your Business
First, we need to establish a clear, technical definition of “Conversion” at a technical level before going into industry benchmarks. “Conversion” is often used as a catch-all term, but it can vary substantially according to particular business models and strategies. Confusing different conversion types is a marketing fundamental mess, like timing a sprinter’s 100-meter dash and then comparing it to a marathoner’s finishing time. Performance is measured in both instances, but the contexts and distances are entirely different.
For an e-commerce store, the ultimate conversion is a macro-conversion, a completed sale. Every interaction and touchpoint is designed to assist a user in reaching the final “Confirm Purchase” button. Yet, in the case of a high-ticket B2B service provider, a direct sale stemming from a website visit is a statistical anomaly. Here, we view conversion as a micro-conversion—a critical first step demonstrating commercial intent, something like a demo request or a whitepaper download.
The Spectrum of Conversions Across Business Models
The ability to accurately interpret conversion rates by industry depends on this clarification. The goalpost determines how you measure success. The definition is the basis of any substantive analysis.
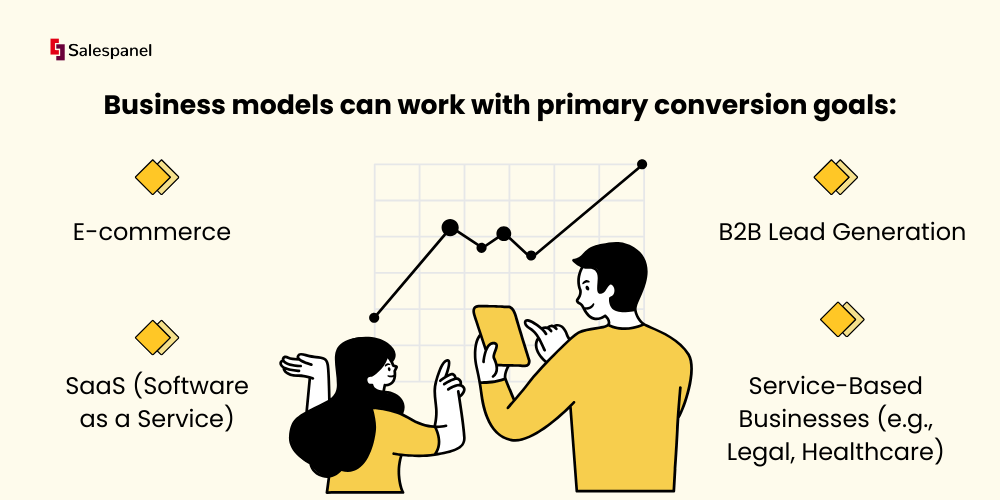
Let’s take a look at how different business models can work with primary conversion goals:
- E-commerce: When a user makes a purchase, that’s a primary conversion. It correlates directly to revenue. Other conversions that can be considered secondary include signing up for a newsletter and adding something to a shopping cart.
- SaaS (Software as a Service): Having a visitor sign up for a free trial that your company offers or booking a product demo can be considered primary conversions. It changes the status of an anonymous visitor to a product-qualified lead (PQL) or marketing qualified lead (MQL).
- B2B Lead Generation: When a potential client submits a “Contact Us” form or downloads a gated asset, such as a case study, that is considered a primary conversion as well. It is information that can be used for further contact by the sales team. It can be considered an explicit signal coming from a potential client.
- Service-Based Businesses (e.g., Legal, Healthcare): When a potential client books a consultation or initiates a phone call, that is also a primary conversion. In these high-trust sectors, primary conversions are much more significant.
Why This Context Is Crucial
If a SaaS company only tracked new paying customers as its primary website conversion, it would compare poorly to an online retailer. This would ignore the most critical milestone in their acquisition funnel, which is trial sign-ups. In the same way, a law firm benchmarking its client acquisition rate against e-commerce sales rates is setting a flawed and discouraging premise. This is most probably going to discourage rather than empower.
Your conversion goal defines your funnel. A clear definition ensures you measure what truly matters for revenue growth, not just vanity metrics. This has to be something that will really grow the revenue and will help avoid questions like, Is this just a vanity metric? Track the specific actions, however convoluted, which move a person from a visitor to a valuable customer.
Industry and Channel Conversion Rate Benchmarks
This is where theory is subjected to the rigor of real-world data. Knowing what a conversion rate means will help, but the real advantage comes from trying to benchmark your performance against industry and channel-specific data. These benchmarks help you to set a performance standard, but also to understand the typical consumer in that market.
To demonstrate, a law firm works in a high-intent, high-trust environment with the objective, most of the time, of getting a phone call. In contrast, an e-commerce store works on removing friction for low-consideration purchases. These baseline operational differences are starkly reflected in the data
An Overview of Industry Performance
A high-level analysis reveals, it’s clear that there is a significant variance in conversion rates across different sectors. This is a result of user intent, purchase complexity, and sales cycle length.
High-trust industries, and more critically, the Finance Industry, having the highest conversion rates on lead-generation activities, hint at the urgent and high-stakes problems users need solved. On the contrary, the travel industry shows lower rates due to exploratory behavior and thus lower lead conversion, as users face a low-stakes issue they need to solve.
Median conversion rates, while hinged around the cross-industry median of around 6.6% for lead forms, tell the true story of conversion confidence. 12.3% median conversion rates in Finance and Legal stem from users with urgent needs. On the flip side, the retail and Travel industries more broadly have median conversion rates of about 3.8%. For more on conversion benchmarks, see unbounce.com for a more granular view.
Benchmarks by Industry and Marketing Channel
More accurate analysis requires segmenting by traffic source. A user clicking on a targeted Google ad, compared to one browsing their social media feed, is in a completely different psychological space. So, of course, not all traffic will convert in the same way.
The table below breaks down average conversion rates for different industries and the marketing channels used to drive their traffic. This information helps in the strategic allocation of marketing resources.
Average Conversion Rates by Industry and Marketing Channel
This matrix provides a lateral comparison of industries to show the most efficient marketing channels to spotlight synergies.
| Industry | Overall Average | Organic Search | Paid Search | Email Marketing | Social Media |
|---|---|---|---|---|---|
| B2B SaaS/Tech | 2.50% | 2.80% | 2.90% | 2.40% | 1.10% |
| Finance | 5.10% | 4.50% | 6.20% | 3.90% | 1.70% |
| Legal | 4.30% | 4.00% | 7.40% | 3.10% | 1.50% |
| E-commerce (Retail) | 2.30% | 2.70% | 2.10% | 3.50% | 1.90% |
| Real Estate | 2.90% | 3.10% | 3.50% | 2.60% | 1.40% |
| Travel & Hospitality | 1.70% | 1.90% | 2.30% | 2.10% | 0.90% |
Note: The data has been aggregated from multiple industry reports. should be used as a directional guide.
The data provided should not be interpreted as a collection of facts and metrics. Rather, it can be viewed as a map and a guide explaining which channels naturally fit with which business models, as well as the areas where optimization focus can provide the greatest return.
Analyzing the Channel-Specific Data
Looking closely at the table provides clear guidance to inform marketing strategy.
Paid Search Dominance in High-Intent Industries: The standout performance of Paid Search for Legal (7.4%) and Finance (6.2%) is a direct result of user intent. Consider a user looking for “emergency business loan” or “corporate litigation attorney,” they are at the bottom of the marketing funnel. Their problem is defined, and they are actively seeking a solution. When users are looking for complete solutions, it makes sense to focus on capturing this demand via paid search ads.
Organic Search as the B2B Powerhouse: For B2B SaaS and other longer sales cycle sectors, Organic Search becomes essential. It allows you to educate potential customers seamlessly. Take the example of a software engineer searching for the query “How to solve API latency issues?” If they come across a detailed technical blog that helps them solve their issues, the blog builds a lot of trust and authority. By the time they consider a paid solution, the brand that provided a solution positions them as a paid, trustworthy expert.
Email Marketing’s Strength in E-commerce: Email Marketing achieves the highest marketing automation conversion rate for E-commerce, at 3.5%. It also helps marketing automation build e-commerce’s strongest relationships. For example, an abandoned cart recovery email sequence is simple to implement automation, but highly effective for targeting users who already showed strong intent to purchase. This is the same for personalized promotions based on purchase history, which are sent to a warm, receptive audience.
The most important part to take from this is that your most effective marketing channel is the one that is most closely aligned to your customers’ decision-making journey. Search solves high-intent problems, while direct communication nurtures relationship-driven sales.
Social Media’s Role in Awareness: Social Media shows the lowest direct conversion rates. This does not indicate failure, but rather a different strategic standpoint. Social platforms are primarily top-of-funnel channels for brand discovery and community building. Users look to be informed or entertained, not to make a purchase. Someone might see your post today and do a branded search a week later. While direct attribution is difficult to track, the role of social media in starting the customer journey is undeniable
Analysis of Variation & Drivers
It’s a classic head-scratcher. You have one financial services firm with a 10% conversion rate and a seemingly successful e-commerce store with a conversion rate of 2%. One might assume that the e-commerce store is losing the marketing game.
But e-commerce and financial services are two different industries. The conversion rate discrepancies are justified by differences in economic, psychological, and logistical factors that influence customer behavior in these two industries.
Recognizing these differences allows one to focus on the real drivers of performance, rather than comparing to an arbitrary benchmark. The focus should be on individual performance, identifying key drivers, and aiming to surpass the averages rather than the industry benchmark.
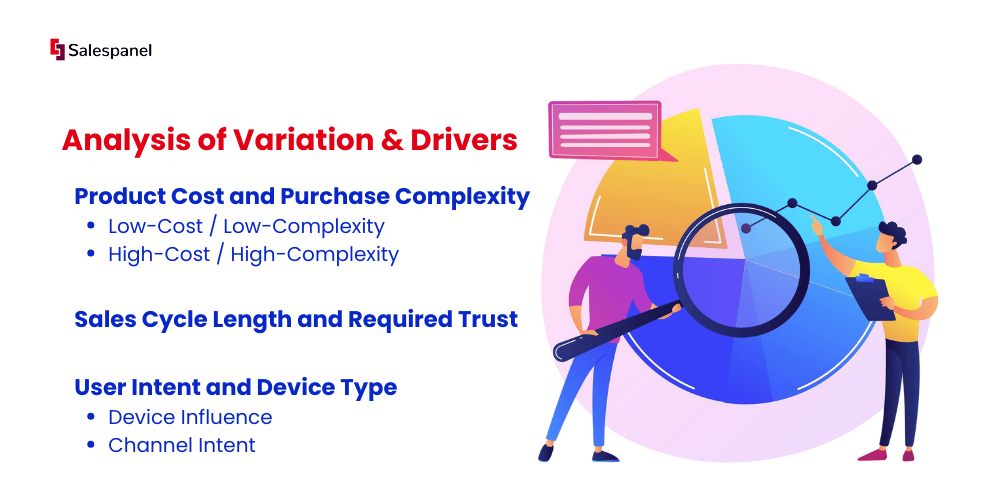
Product Cost and Purchase Complexity
The primary reason for the discrepancies comes down to the size of the ask associated with a purchase. The more a purchase costs, in any form, the more friction you will have, and the lower the conversion rate will be.
Consider the difference in mindset:
- Low-Cost / Low-Complexity: A $20 t-shirt is often an impulse buy, and there’s little financial risk. In this case, the buyer knows exactly what they’re getting. This is why conversion rates get higher-the barrier to saying “Yes” is incredibly low.
- High-Cost / High-Complexity: In contrast, saying yes to a $50,000 B2B software package is a huge deal. There’s a lot of work to get this to go through, as it involves stakeholder buy-in, demos, deep research, and contracts. A “Demo Request” conversion is low because it involves more complexity.
This explains why the legal services industry gets a lower conversion rate for a final sale, but a fantastic conversion rate for top-of-funnel actions like downloading a free guide.
Sales Cycle Length and Required Trust
Tied directly to complexity is the time it takes for a customer to pull the trigger. If it takes a long time to make a sale, a customer has to interact with you a lot before they make a decision. This will, of course, reduce the chances of conversion for any one of those interactions.
A conversion rate is basically a mirror reflecting the amount of trust required to take an action. If the risk seems relatively high, trust will take time to build.
Consider a popular blog that talks about surgery. It’s unrealistic to expect that a patient will be willing to pay for and schedule surgery just off a blog post. It will take multiple appointments and consultations to build that trust. This is starkly different from your weekly online grocery order. This is a transaction of low trust that is frequent and highly trusted.
User Intent and Device Type
Understanding the reason behind each visit is important. Consider the person on their mobile phone searching for “emergency plumber near me.” That person is ready to become a customer and to make a conversion. As opposed to someone on their tablet, Pinterest browsing for home decor on a Sunday night. That person is just exploring.
- Device Influence: Mobile conversions still tend to lag behind desktop. This is especially the case for activities that involve a good deal of contemplation and or typing. Specification comparisons and long forms tend to be filled on larger screens. But simpler purchases and mobile devices reign. We already mentioned this, but it needs to be emphasized.
- Channel Intent: Traffic from Paid Search almost always converts better than traffic from Social Media. This is simply because one person is actively problem-solving and the other is just mindlessly scrolling.
These elements are added to the mix with global and regional consumer habits. History tells us that even with one industry type, performance differs greatly by geography. For example, one analysis of billions of sessions found that while retail brands attained an average global conversion rate of 2.7%, Great Britain achieved 4.1%, and other markets straggled at around 1.3%. To dive into purchase intent variability, one can look into the detailed description of the e-commerce benchmarks for a more granular view.
Ultimately, these statistics demonstrate that cultural, behavioral, and economic realities make the whole benchmarking process even more complicated.
Turning Benchmarks Into Actionable Growth Strategies
Knowing your industry’s conversion benchmarks is the starting line, not the finish line. That data is useless if it just sits in a spreadsheet. It becomes relevant only when you use it to formulate a clear growth strategy. This is the part where we stop merely counting the conversion rates and start optimizing them for growth.
Think of this section as your playbook for turning those industry stats into an engine for improving your own performance. We’re shifting the focus from data comparison to a real-world Conversion Rate Optimization (CRO) system. The objective is to stop merely reacting to the numbers and use them to engineer deliberate growth.
Setting Realistic Goals and KPIs
First things first: You need to ground your ambitions in reality. Now that you have the benchmarks, you will be able to set KPIs that are not only going to stretch your limits but are actually going to be possible to reach. It’s time to stop setting goals that have no clear value. You will now be able to set precise targets.
- Overall Performance: Imagine your site converts at 1.8% while the industry average is 2.5%. It would not be realistic to set a goal to get to 5% in one shot. A more intelligent KPI would be a KPI to aim for 2.15% in six months. This way, close that gap by half within six months.
- Channel-Specific Targets: Suppose one of your channels has a good 3.0% conversion rate through organic search. That’s good! But a paid search conversion rate of 1.5% is a cause for concern—especially when compared to the 2.9% average. This should tell you what the main issue is. Your immediate goal should be to find out what is causing the paid search funnel to leak and fix it.
- Conversion Type Goals: Suppose you have a situation where your form submissions convert at a decent 4% and phone calls are disappointing at 0.8%. In this case, your goal should be much more specific than just “more conversions.” In this case, you could set the goal of “increasing qualified inbound calls by 25%.” This could be achieved by making your calls to action more dominant and persuasive.
Auditing Your Funnel With a Data-Driven Lens
Now that you have established goals, it’s time for a rigorous audit of your conversion funnel. This is where you do some groundwork and dig into your own analytics to understand the why behind your numbers. This is not about understanding what is happening, but rather investigating the reasons for the occurrence.
Conducting a proper audit requires segmenting your data to find the hidden stories. Analyze conversions through filters, for example:
Device Type: Is a clunky mobile experience cratering your overall average? If your desktop converts at 4% but mobile is stuck at 1%, you’ve just found your top priority.
Landing Page: Do some pages have a conversion rate that is far above the average, while others are losing visitors at obscene rates? Analyze your top performers and identify the elements they have that can be replicated on your lower-performing pages, e.g., clear headlines, social proof, and simple forms. You can use tools like Salespanel to map the most converting customer journeys with landing pages.
Traffic Source: Analyze beyond just the channel. Within organic search, identify which blog posts or keywords are the most valuable to your leads. You will find what type of content resonates with active consumers.
This kind of detailed analysis helps you move from a general educated guess with various possible solutions to a clear, focused, and solvable problem.
Connecting CRO to the Full Customer Journey
Great CRO isn’t just about tweaking button colors and or changing the text on your webpages. A great CRO requires understanding the entire journey a customer travels long before thinking about converting. Particularly in B2B marketing, understanding user behavior and the actual quality of a lead can change the game.
Take, for example, the page with a low conversion rate on “Request a Demo.” An easy fix in this case may be to shorten the form. But what if deeper analysis shows you that the best leads (the ones who close the deal) almost never convert there at all?
Effective growth strategies look well beyond the last click and focus on the complete sequence of actions that lead to the building of a prospect’s confidence and intent in the purchase, and understand that each and every touchpoint along the journey is important.
As in the previous example, using a tool with Website visitor tracking from Salespanel lets you find out the specific pages visited in the lead up to form submission. You may learn that high-quality leads repeatedly access your pricing page, a specific case study, and a technical integration document.
This also contributes to a more intelligent optimization strategy. With Salespanel’s lead scoring system, you can automatically assign points for these high-intent behaviors. For example, someone who checks out the pricing page gets +10 points, while someone who only reads a few blog posts gets +2.
All of a sudden, you have a system that automatically prioritizes prospects that are showing strong signals of intent to buy. Your sales team can stop chasing after every single form submission and focus instead on leads that are most likely to say ‘yes.’ That is how you improve not just your website conversion rate, but your sales conversion rate as well.
So, What’s Next? Turning Data Into Dollars
You understand the numbers, the context, and the overview you’ve been provided. You now realize that conversion rate by industry isn’t just a bunch of abstract stats. These are indicators of the levels of trust, the intention, and the decision-making process of your audiences.
But if you remember only one thing from this guide, remember that this data is not the final grade on your report card.
A benchmark is not the finish line. It is the starting pistol for a continuous, intelligent cycle of testing, learning, and tweaking. That is what distinguishes the businesses that just survive from those that truly thrive.
The goal was never to just figure out if your rate is “good” or “bad.” You want to stop estimating and begin making smart, data-driven choices.
Your Game Plan for Sustainable Growth
You have seen a financial services company with a conversion rate of 5% and a travel brand with 2% both succeeding within their industry. You understand that different definitions of success can stem from product pricing, time taken to close a deal, and the origin of your traffic.
Knowing where you stand clears the way ahead. You’re ready to do the following:
- Set Goals That Make Sense: Establish your targets using these industry benchmarks. Make sure the goals you set for your overall rates, channel-specific rates, or even device-specific conversion rates are ambitious yet realistic.
- Diagnose Your Funnel: Don’t stop at the basic calculations. Analyze your data in various ways to pinpoint the friction areas where you are losing the most sales. Is the problem an inconvenient mobile experience or an underperforming landing page? You can tell now and fix it.
- Prioritize Like a Pro: You now know which areas in your industry to focus on. This will let you avoid the common mistake of trying to fix everything at once and instead let you narrow your time and budget to the channels and strategies likely to offer the most return.
From Insights to Action
The jump from understanding your metrics to actually improving them involves more than surface-level tweaks. You must examine the whole customer journey, from the first time they hear about you to the moment they click “buy.”
This is where you connect the dots.
Understanding customer behavior just prior to conversion will allow you to fine-tune your marketing and sales process. This is how you transform your website from a static online brochure into a smart system. Make your website self-service to actively guide your most valued prospects and allow your sales team to focus on high-potential deals.
The insights you’ve picked up from this guide are your new starting line. Audit your performance, establish your first goal based on your data, and embrace the system and process. This is the most authentic way to achieve growth in your conversions over time.
Frequently Asked Questions
After digging through all this data, a few common questions always seem to pop up. This should help you utilize these benchmarks without focusing too much on the minutiae.
What Is a Good Conversion Rate for My Industry?
This is the most important question a business owner can ask. But the answer is, ‘it depends’. While the benchmarks in this article are a good starting point, they are not a destination. For example, if you run a legal services firm, hitting 7 to 8% on paid search is a good target. But if you are an e-commerce seller of home decor, achieving 2% could be a huge win.
However, what really counts is your conversion rate compared to your rate from the previous month. Your own upward trend is the most critical metric. You should also consider profit margins and conversion rates. A low conversion rate on a high-ticket service is much more profitable than a high rate on a low-margin product.
How Often Should I Benchmark My Conversion Rates?
You’ll want to get into a rhythm of checking your key conversion metrics monthly. This timeframe is ideal because it allows you to notice emerging trends and assess the impact of your latest campaigns without fixating on daily fluctuations.
For the long term, it’s best to compare your numbers to broader industry data quarterly or semi-annually. This is the best time to revise your long-term objectives, assess the state of the industry, and make sure that your goals are aligned with industry standards.
The exception to this would be when you are looking at the results from a significant A/B Test or site redesign that you intend to monitor daily or weekly to assess the immediate impact, whether positive or negative.
Finally, remember that the purpose of regular benchmarking isn’t to say you’ve ticked a box, but that you’ve created a continuous feedback loop that tells you what is working, what isn’t, and the best areas to concentrate your effort on next.
My Rate Is Below Average. What Do I Do First?
If your numbers are lagging, the first rule is: Diagnose before you prescribe. Although it may feel like the best solution is to overhaul everything, this will likely create more confusion. Instead, you should start by investigating the problem.
- Segment Your Data: Don’t just look at the overall rate. Break it down by channel, device, and landing page. For example, you may discover that your desktop conversion rate is great, but you have a poor mobile experience, which is causing the average to decline.
- Analyze User Behavior: Use heatmaps and session recordings to analyze user behavior. Identify where people click, where they hesitate, and where they abandon the session. Some common reasons users abandon a session include slow page loads, poor navigation structures, nightmarish forms, or a call-to-action (CTA) that’s too weak to inspire a click.
- Start with Quick Wins: While you plan bigger fixes, look for low-hanging fruit. For example, rewriting a vague headline, adding a customer testimonial, or removing one form field can substantially improve performance.
How Do I Accurately Track Conversions Across Multiple Touchpoints?
If your attribution model is last-click focused, you’re probably just seeing the last five minutes of the movie. Everything else is the ‘research, blogs, and social media stalking’ that happened before your last ‘conversion’. To tell the whole story, you need a complete multi-touch attribution model.
This is extremely important for B2B companies that have lengthy and complex sales cycles. In these cases, dedicated tools really do become essential. Take Salespanel, for example, with its website visitor tracking, you can now link anonymous website visits to specific accounts and individuals. You can track every interaction they have with your content from the first time they read a post to the point they requested a demo and stitch together a unified story of how a lead becomes a customer.
At Salespanel, we use the tracking tools we build to understand conversions and the story that lies behind them. Move beyond basic analytics and start identifying your most valuable prospects with advanced tracking and lead scoring. We have tons of resources to help you explore this.
Sell more, understand your customers’ journey for free!
Sales and Marketing teams spend millions of dollars to bring visitors to your website. But do you track your customer’s journey? Do you know who buys and why?
Around 8% of your website traffic will sign up on your lead forms. What happens to the other 92% of your traffic? Can you identify your visiting accounts? Can you engage and retarget your qualified visitors even if they are not identified?