What is Data Reporting? Best Practices in the Post-GDPR Era
Data is now an indispensable resource for businesses of all sizes. It is the new oil!
With so much data collected by businesses these days, processing and handling information and deriving actionable insights from it is a challenge in itself.
You may have the best data but if they’re not driving effective decisions, what’s the point? Your data is only as effective as the insights you get and how those insights can be translated into actions.
This is where data reporting plays a crucial part.
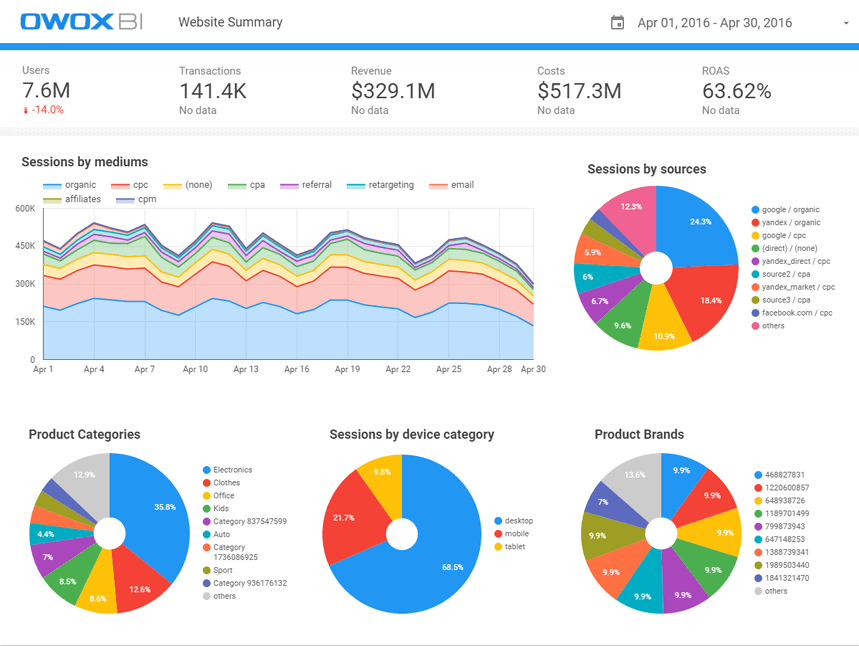
Image Source: Owox
What is Data Reporting?
Data reporting involves collecting, analyzing, and presenting data in a structured and meaningful way. It transforms raw data into clear and concise reports that provide valuable insights and facilitate informed decision-making. These reports are designed to convey insights, trends, and key metrics to assist in decision-making by the leadership.
In data reporting, the raw data is carefully examined, filtered, and organized to highlight the most relevant information. It is then presented in a visually appealing format, often using charts, graphs, and tables, to enhance clarity and understanding.
This allows stakeholders, such as managers, executives, or analysts, to grasp important patterns, assess performance, and identify opportunities for improvement.
Data reporting plays a crucial role in enabling evidence-based decision-making. A Mckinsey report shows that data-driven organizations are 19 times more profitable.
It empowers them to make informed choices, set goals, and monitor progress toward achieving organizational objectives.
Moreover, data reporting fosters transparency and accountability within organizations. It facilitates effective communication by providing a common language for discussing data-driven insights. This enables organizations to align their strategies, optimize processes, and drive continuous improvement.
Types of Data Reports
Multiple data report types achieve different objectives. Here is a list of the most useful report types for B2B businesses.
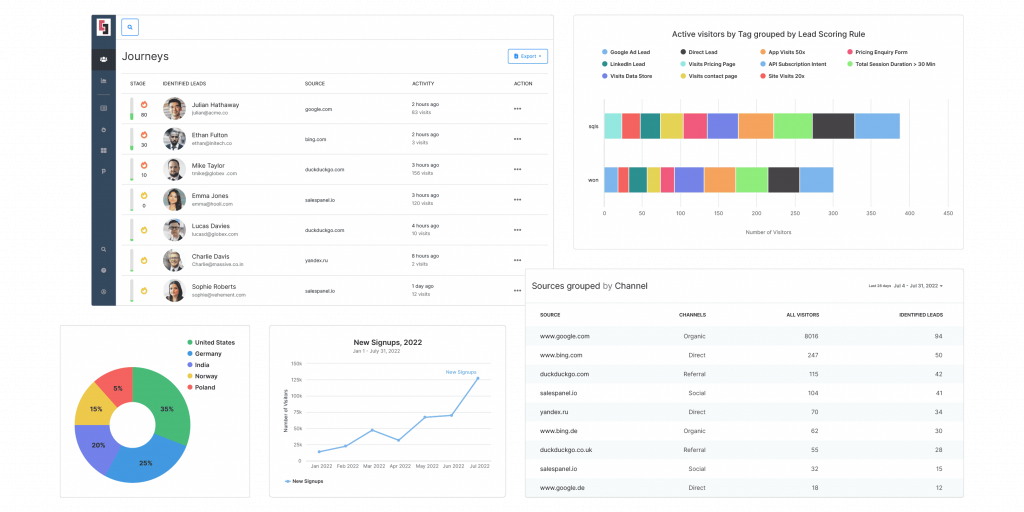
Customer Acquisition Reports
Customer acquisition reports analyze data related to customer acquisition efforts and marketing campaigns. They provide insights into lead generation, conversion rates, cost per acquisition, and marketing channel performance.
These reports assist businesses in assessing the effectiveness of their marketing strategies. Thus they can optimize their customer acquisition processes, and allocate resources more efficiently.
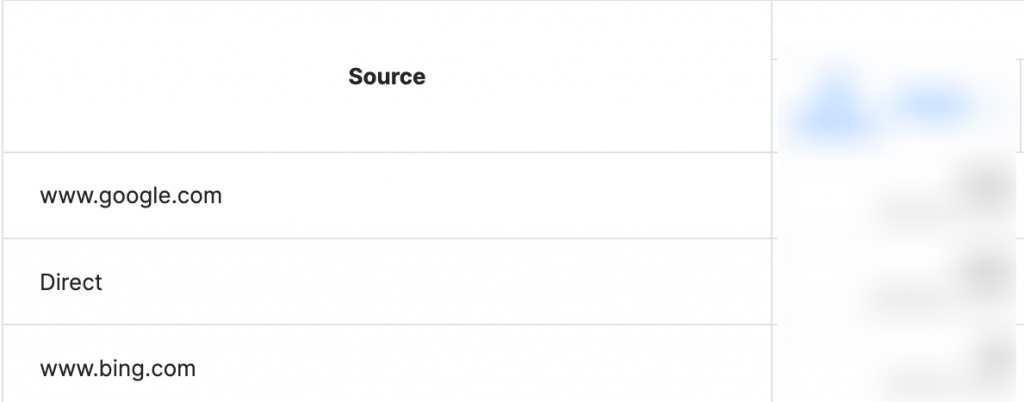
Acquisition reports on Salespanel
Customer Satisfaction and Feedback Reports
These reports capture customer satisfaction levels, feedback, and sentiment analysis. They can include metrics such as Net Promoter Score (NPS), customer survey results, customer support ticket trends, and social media sentiment analysis.
Customer satisfaction and feedback reports help businesses understand their customers’ experiences, identify areas for improvement, and enhance customer loyalty.
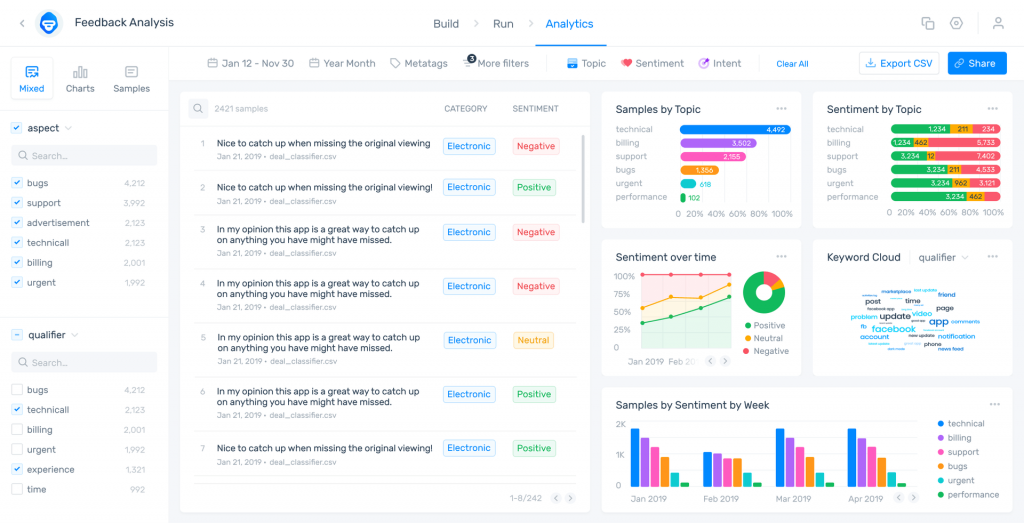
Image Source: Monkey Learn
Market and Competitive Analysis Reports
Market and competitive analysis reports provide insights into industry trends, market share, customer preferences, and competitive intelligence. They help businesses understand market dynamics, and identify market opportunities.
This makes assessing competitor strategies easy. Coupled with data-driven decisions, gaining a competitive edge becomes possible.
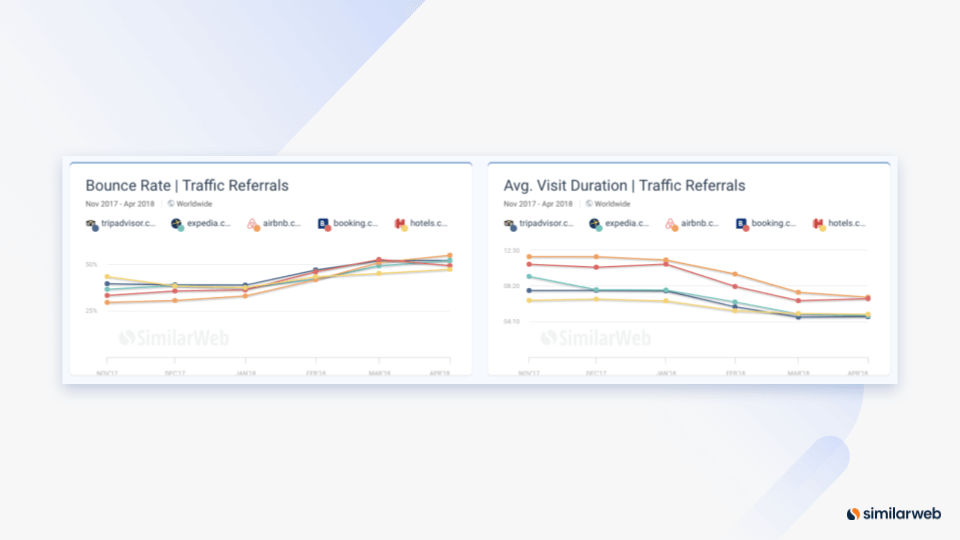
Image Source: Similarweb
Churn and Retention Reports
Churn and retention reports focus on tracking customer retention rates and identifying factors that contribute to customer churn.
They provide visibility into churn metrics, such as churn rate, reasons for churn, and customer lifetime value. These reports help B2B companies identify potential churn risks, optimize customer retention strategies, and enhance customer success efforts.
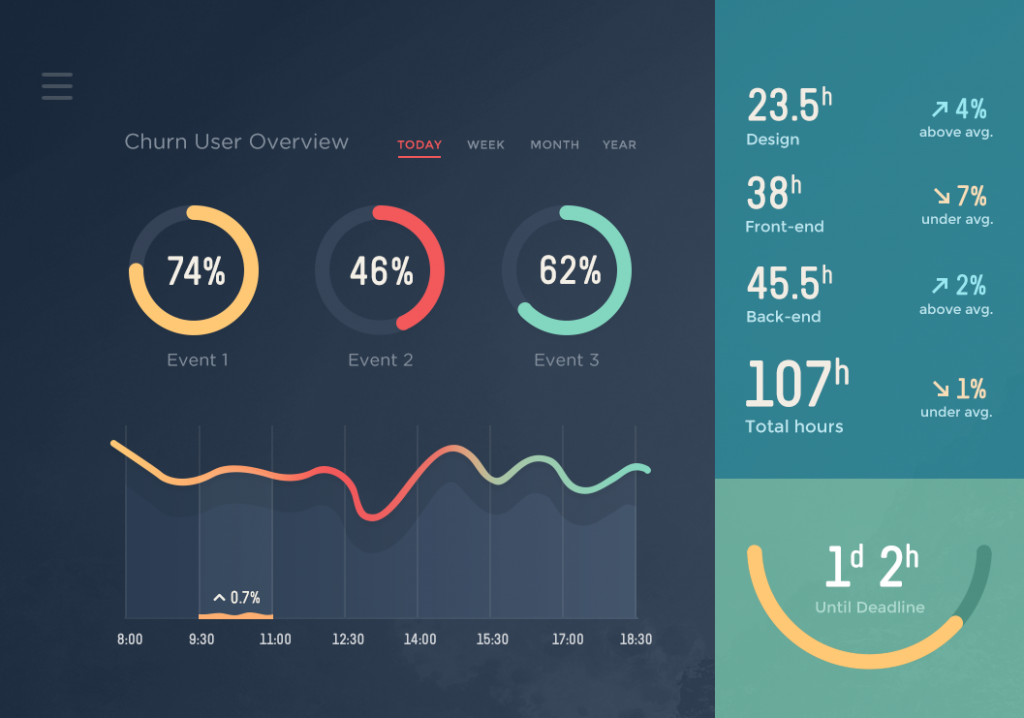
Image Source: Renevera
Marketing Reports
A Marketing Report offers organizations a complete picture of what works best across all of their marketing channels, such as website traffic, social media interaction, email campaigns, and more, in one location. A reporting tool (like Salespanel) displays a company’s real-time data, KPIs, metrics, and analytics that are used in gaining insights through visual representation.

Sales and Pipeline Reports
Sales and pipeline reports track the sales activities, pipeline progress, and deal conversion rates. They offer insights into lead generation, deal stages, conversion rates, win/loss analysis, and sales performance metrics.
These reports help sales teams and management assess sales effectiveness, optimize the sales process, and identify areas for improvement.
Trend Analysis Reports
These reports focus on identifying patterns and trends over time in the market and customer expectations. They analyze historical data to detect recurring patterns, fluctuations, or shifts in performance.
Trend analysis reports help stakeholders understand long-term trends and make informed predictions or projections.
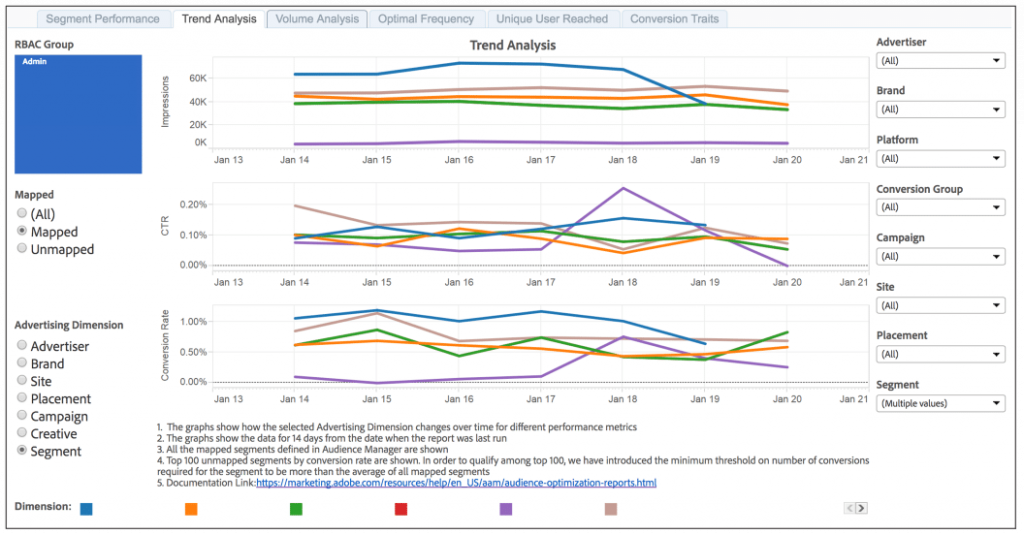
Image Source: Adobe
Investigative Report
An investigative report is a detailed document that presents the findings, analysis, and conclusions resulting from a thorough investigation into a specific matter or issue. It is a comprehensive account of research, data collection, and examination of evidence related to the subject under investigation.
The purpose of an investigative report is to uncover and document relevant facts, circumstances, and events surrounding the issue being investigated.
Monitoring Marketing Performance Through Reports
Data reporting enables us to monitor and assess the performance of marketing campaigns from different perspectives. These reports offer a systematic way to track key performance indicators (KPIs) and measure the success of marketing initiatives. Here’s how reports contribute to monitoring marketing performance.
Reports offer valuable visibility into campaign metrics, encompassing website traffic, conversion rates, click-through rates, and engagement levels. Consistently monitoring these metrics allows businesses to assess their marketing efforts’ performance, seize opportunities, and make informed decisions.
Moreover, reports play a vital role in measuring the return on investment (ROI) from marketing activities. By analyzing data pertaining to marketing spend, revenue generation, and customer acquisition costs (CACs), businesses can evaluate the profitability of their marketing campaigns.
Additionally, reports empower businesses to effectively segment and analyze their target audience. By evaluating customer demographics, behavior patterns, and preferences, companies can customize their marketing strategies to suit specific segments, maximizing their chances of success.
Furthermore, reports provide valuable insights into the effectiveness of various marketing channels. Through comparing performance across different channels, businesses can determine which channels are most effective in driving revenue. Thus, more resources can be allocated to top-performing channels and strategies can be tweaked for those not performing well.
Reports also facilitate competitor analysis by monitoring market share, customer sentiment, and competitive intelligence. This information helps businesses understand their competitive landscape and make informed decisions to stay ahead.
Best Practices for Data Reporting
Define Clear Objectives
Clearly define the purpose and objectives of your data reporting. Understand the specific questions or problems the report aims to address.
This helps you focus on relevant data and ensures that the report provides actionable insights aligned with your intended goals.
Gather Reliable and Accurate Data
Ensure the data used in your report is reliable, accurate, and sourced from trustworthy and relevant sources.
Perform data validation and verification to minimize errors and inconsistencies. Avoid relying on incomplete or outdated data that may lead to misleading conclusions.
Leverage Visualizations
Utilize visualizations such as charts, graphs, and infographics to present complex information clearly and concisely.
Choose visual representations that best represent the data and make it easier for the audience to understand key insights. Ensure the visualizations are accurate, visually appealing, and enhance the overall storytelling of your report.
Provide Context and Insights
Data alone may not convey its significance. Provide context and insights to help the audience understand the implications of the data.
Explain the trends, patterns, and relationships observed in the data and offer meaningful interpretations. Provide actionable recommendations based on the findings to guide decision-making processes.
Ensure Clarity and Simplicity
Keep the language and presentation of your report clear and concise. Avoid jargon or technical terms that may confuse the audience.
Use plain language and explain complex concepts or terminology where necessary. Organize the report in a logical structure with headings, subheadings, and a table of contents for easy navigation.
Tailor Reports to the Audience
Consider the needs, preferences, and expertise of your target audience when designing and presenting the report. Customize the level of detail, language, and format to match the audience’s knowledge and requirements.
Highlight the most relevant insights and metrics that are actionable and meaningful to the specific audience.
Regularly Review and Update Reports
Data reporting is an iterative process. Regularly review and update your reports to reflect changing business needs, new data sources, or evolving objectives. Seek feedback from the audience to identify areas for improvement and ensure that the reports continue to provide value over time.
Marketing Data Reporting with Salespanel
Data reporting can supercharge your marketing operations and help you leverage insights to greatly improve lead inflow, marketing performance, and customer engagement.
With Salespanel, you can leverage data visualization and be creative with how you present important data. You will have the freedom to choose and customize reports as per your liking.
Salespanel reporting works in real-time. This means you optimize your campaigns or personalize customer experiences on the fly. You will also be able to capitalize on unexpected opportunities and make windfall gains.
The best part? Salespanel makes sharing data reports easy. You can add multiple team members to the loop to keep them informed. Or generate actionable data reports quickly to share them with the top executives.
All of these powerful things can be done through a customizable and easy-to-use interactive dashboard. Thus, Salespanel makes reporting, and data-driven decision-making effortless.
Sign up today and transform your marketing operations!
Sell more, understand your customers’ journey for free!
Sales and Marketing teams spend millions of dollars to bring visitors to your website. But do you track your customer’s journey? Do you know who buys and why?
Around 8% of your website traffic will sign up on your lead forms. What happens to the other 92% of your traffic? Can you identify your visiting accounts? Can you engage and retarget your qualified visitors even if they are not identified?