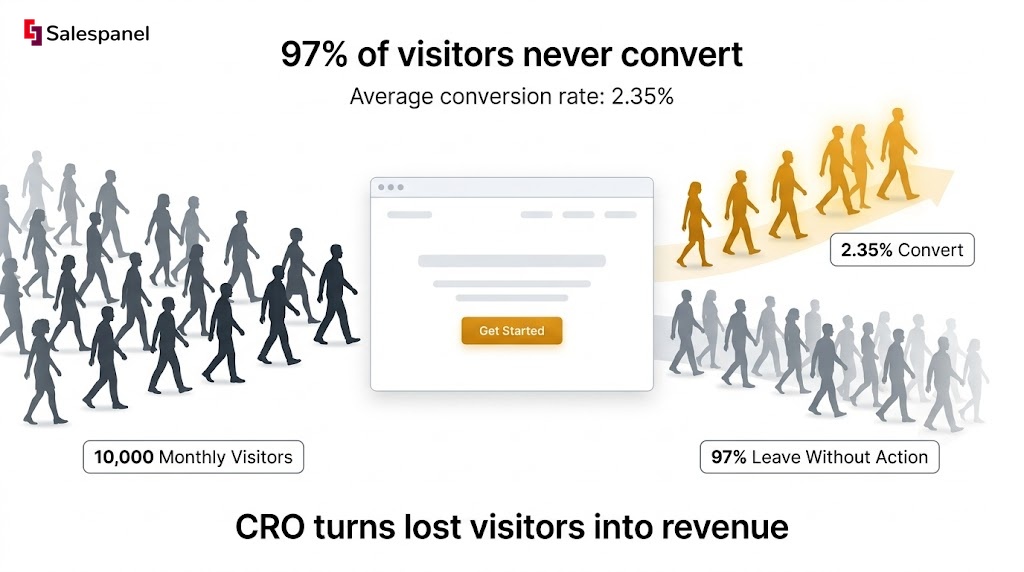
For decades, digital marketing operated on a simple premise: more traffic equals more revenue. This led to a relentless focus on acquisition, driving costs skyward. Today, that model is obsolete. The future of digital growth lies not in attracting more visitors, but in converting the ones you already have. Website conversion rate optimization (CRO) has evolved from a niche tactic of testing button colors into a data-driven, strategic discipline essential for survival. Consider this: the average website conversion rate hovers around a mere 2.35%, meaning over 97% of visitors leave without taking action. This guide provides a technical framework for systematically capturing that lost opportunity.
Why Website Conversion Rate Optimization Is Essential
Customer acquisition costs are perpetually rising. Consequently, extracting maximum value from existing traffic is no longer optional—it’s a fundamental business imperative. Website conversion rate optimization is the methodical process of understanding user behavior and refining the digital experience to guide more visitors toward a desired action.
The central theme is a shift from assumption to evidence. By analyzing how users actually interact with your website, rather than how you think they do, you can identify and eliminate points of friction. This transforms your website from a passive digital brochure into an active, high-performing component of your sales and marketing apparatus. When executed correctly, CRO allows for validated, incremental changes that yield a significant return on investment.
The Financial Impact of Small Improvements
The power of CRO is rooted in its compounding effect. A minor lift in your conversion rate doesn’t just generate a few additional leads; it directly amplifies revenue without increasing ad spend.
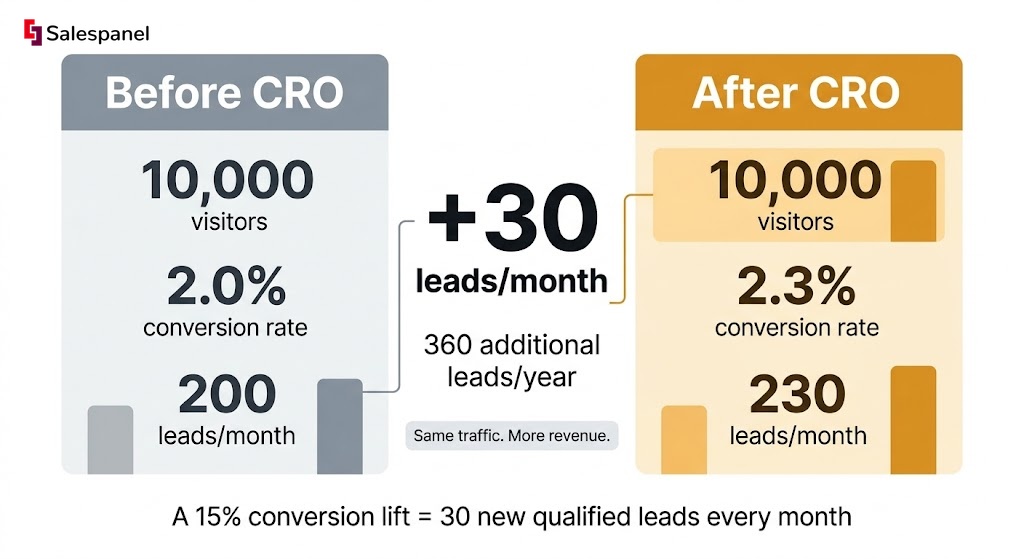
To illustrate this, consider a B2B company attracting 10,000 monthly visitors. With a baseline demo request form conversion rate of 2%, they generate 200 leads. A focused CRO initiative can realistically deliver a modest uplift.
The table below quantifies the impact of a 15% lift in conversion rate—a highly achievable target for a new CRO program.
The Compounding Impact of Incremental Conversion Lifts
| Metric | Baseline Scenario | Scenario with 15% CRO Lift |
|---|---|---|
| Monthly Website Visitors | 10,000 | 10,000 |
| Conversion Rate | 2.00% | 2.30% |
| Total Monthly Leads | 200 | 230 |
| Increase in Leads | – | +30 leads/month |
This marginal 15% improvement yields 30 new qualified leads monthly, or 360 additional leads annually, from the same traffic volume. The takeaway is unequivocal: neglecting active optimization results in quantifiable lost revenue.
Now, project the impact of a more substantial improvement. The following chart visualizes how elevating the conversion rate from 2% to 5%—a 150% improvement—can fundamentally reshape lead generation.
This visual demonstrates that lead volume can be more than doubled without any corresponding increase in media spend.
From Guesswork to Data-Driven Decisions
Modern CRO has moved beyond subjective decision-making. Historically, website modifications were often predicated on intuition or competitive mimicry. Today, optimization is grounded in a scientific understanding of user behavior.
A robust CRO program is built upon two analytical pillars:
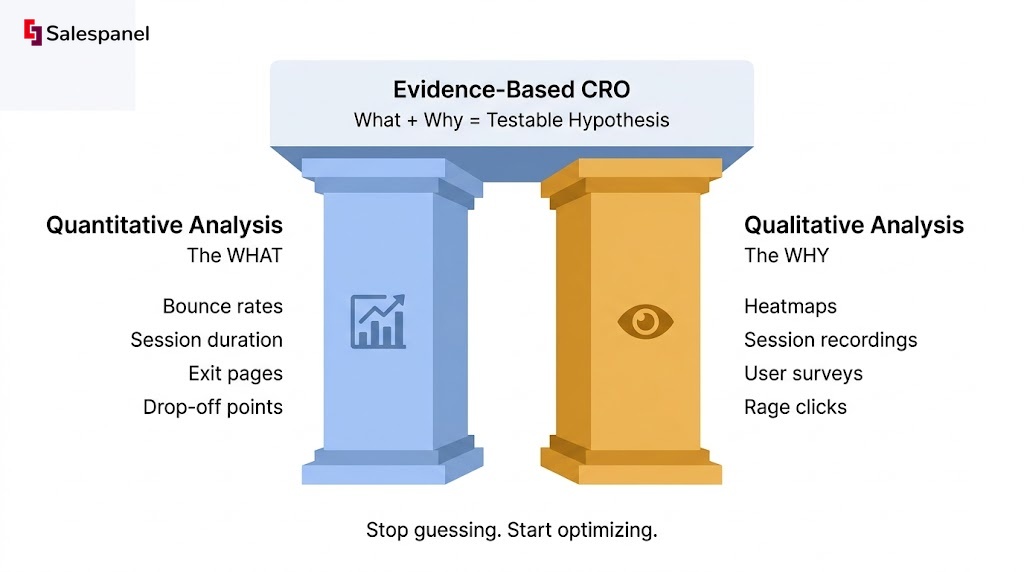
- Quantitative Analysis: This involves the interpretation of hard data. Using analytics tools, you examine metrics such as bounce rates, session duration, and exit pages to identify where user drop-off occurs.
- Qualitative Analysis: This addresses the “why” behind the quantitative data. Tools like heatmaps, session recordings, and user surveys reveal what users click, how far they scroll, and their direct feedback on the user experience.
By synthesizing quantitative data (the what) with qualitative insights (the why), you can formulate strong, testable hypotheses. This evidence-based methodology minimizes risk and maximizes the probability of impactful changes.
This mirrors the core philosophy of understanding the end-to-end customer journey. By monitoring user actions from their initial anonymous visit, you gather the intelligence needed to deliver personalized, resonant experiences.
For example, website visitor tracking from Salespanel reveals a prospect’s complete journey—every page viewed and piece of content engaged with before they convert. This contextual data provides insight not just that a conversion occurred, but why. The average ecommerce conversion rate hovers between 2.5% and 3%. Strategic adjustments to copy or layout can yield significant gains. Personalizing messaging has been shown to boost customer re-engagement by 50% and sales conversions by 21%.
Building Your Data-Driven CRO Foundation
Successful website conversion rate optimization is built on data, not assumptions. Before improving the user experience, you must first understand it. This requires moving beyond surface-level metrics to establish a framework that captures granular user behavior. The objective is to view your website through your visitors’ eyes, pinpointing moments of confusion, frustration, or delight.
This process begins by configuring analytics to track specific interactions. Move beyond page loads and focus on what users do. Do they click key calls-to-action? How far do they scroll before disengaging? Where do they hesitate on a form? Answering these questions provides the raw material for evidence-based hypotheses.

This screenshot exemplifies a comprehensive visitor journey map. It visualizes every touchpoint, from the initial visit through to conversion. Tracking the complete journey provides invaluable context, revealing which marketing channels and content assets are most effective at driving high-value actions.
Uncovering User Intent with Qualitative Data
While quantitative data from analytics tells you what is happening, qualitative data explains why. Tools like heatmaps and session recordings are essential for this deeper layer of insight, transforming abstract numbers into visual narratives of user behavior.
A heatmap, for instance, aggregates clicks, taps, and scroll depth into a visual overlay. A practical example: you might discover users are frequently clicking a non-interactive image. This signals a design flaw or a missed opportunity for a valuable link—a clear, actionable insight that quantitative data alone would miss.
Session recordings provide video playbacks of individual user sessions. Watching users rage-click a broken button, struggle to locate information, or abandon a checkout process at a specific step offers a direct window into their experience. These are not just data points; they are firsthand accounts of usability issues.
The core principle of data-driven CRO is to combine the “what” from analytics with the “why” from qualitative tools. This synthesis allows you to move from guessing to making informed decisions based on actual user behavior.
This approach aligns with the philosophy of tracking the complete customer journey. Understanding anonymous visitor behavior is the first step toward personalization and lead qualification. Knowing which pages someone has viewed or which resources they’ve downloaded allows for a more tailored experience and more accurate intent scoring.
Setting Up Meaningful Event Tracking
To build this data foundation, you must define and track specific events aligned with business objectives. A generic analytics setup is insufficient for serious website conversion rate optimization. You must configure your tools to capture the micro-conversions that precede primary conversion goals.
Here are practical examples of events to track:
- Button Clicks: Instead of only tracking page views for a demo request page, track clicks on the “Request a Demo” button itself. This helps validate button visibility and copy effectiveness.
- Scroll Depth: Tracking scroll depth (e.g., 25%, 50%, 75%, 100%) indicates content engagement. If most users only see the top 25% of a key landing page, your primary message is likely being missed.
- Form Field Engagement: Monitor which form fields users interact with and where they abandon the process. A high drop-off rate on a specific field, such as “Phone Number,” signals a point of friction.
- Video Plays: For video content, track play rates and watch time. This data reveals how engaging your videos are and whether they are effectively communicating your message.
This level of detailed tracking is a hallmark of a mature CRO program. For B2B companies, website visitor tracking from Salespanel can automate much of this. It captures the full sequence of user actions and ties them to a single visitor profile, creating a rich dataset that shows how behavior evolves over multiple sessions. This provides the deep insights needed to optimize the entire customer lifecycle.
By implementing this robust data framework, you transition from a reactive to a proactive, systematic process of continuous improvement.
Analyzing Traffic Quality to Find Your Best Customers
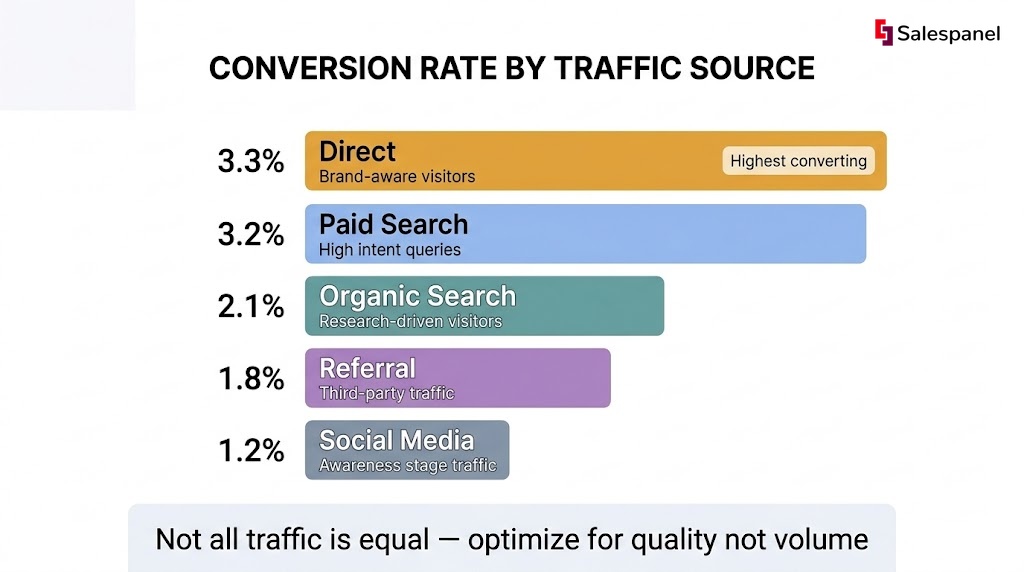
Not all website traffic is created equal. A critical component of any intelligent website conversion rate optimization strategy is differentiating between casual browsers and high-intent prospects. This analysis begins at the source.
Different channels—organic search, paid ads, social media campaigns—deliver audiences with varying mindsets. Mastering traffic analysis enables you to focus resources where they will generate the highest return. A visitor arriving from a specific, long-tail search query has a fundamentally different intent than one who clicked a link on social media. Understanding these nuances is the first step toward creating a user experience that meets visitor expectations, which is the foundation of higher conversions.
Segmenting Traffic by Source and Intent
Your analytics platform is the primary tool for this task. Begin by segmenting your traffic by source: organic search, direct, referral, paid search, and social media. Then, examine behavioral metrics that indicate quality and engagement.
- Conversion Rate per Channel: This is the most direct metric. If paid search traffic converts at 4% while organic search converts at 1.5%, it suggests your ad targeting is effectively attracting a motivated audience.
- Bounce Rate: A high bounce rate from a specific channel is a red flag, often indicating a mismatch between the ad’s promise and the landing page’s content. A 90% bounce rate from LinkedIn ads, for example, suggests the message that drove the click was not aligned with the landing page experience.
- Pages per Session: High-quality visitors tend to explore more of your site. If traffic from a guest post on an industry blog averages five pages per session, you have identified a source of relevant, engaged users.
- Time on Page: Similar to pages per session, longer engagement times indicate your content is resonating. This is a crucial metric for evaluating the effectiveness of blog posts or resource centers.
Analyzing these metrics across channels provides a clear picture of where your most valuable customers originate. This shifts the focus from traffic volume to traffic value.
The Measurable Impact of Different Channels
Traffic source has a direct, measurable impact on conversion probability. Data shows that direct visits—when a user types your URL directly into their browser—often yield the highest average conversion rate, at approximately 3.3%. Paid search follows closely at 3.2%, though this figure can vary significantly by industry.
This underscores a critical truth: visitors who are already familiar with your brand or are actively searching for your solution are inherently more valuable. Your CRO strategy must ensure their path to conversion is as seamless as possible.
Practical Application: Tailoring the Experience
Once high-quality traffic sources are identified, the next step is to tailor the user experience accordingly. This is where analysis translates into action.
The objective is not merely to identify your best traffic but to create an environment that caters specifically to that traffic’s intent. This involves aligning the landing page message, the offer, and the entire user journey with the expectations set by the source channel.
For example, analysis reveals that traffic from a LinkedIn ad campaign converts exceptionally well on webinar sign-up pages but bounces from blog content. This insight enables several strategic actions:
- Redirect Ad Spend: Increase investment in the LinkedIn campaign, confident that it delivers high-intent leads for a specific conversion goal.
- Optimize the Landing Page: Create a dedicated landing page for LinkedIn traffic that uses language and visuals mirroring the ad, ensuring a cohesive user experience.
- Refine Your Content Strategy: The data suggests your blog content may not meet the needs of the professional, solution-oriented audience from LinkedIn. Test different content formats or adjust topics to better engage this segment.
This is how website conversion rate optimization evolves from simple A/B testing to a core strategic function. By systematically analyzing traffic quality, you not only improve conversion rates but also enhance the efficiency of your entire marketing budget.
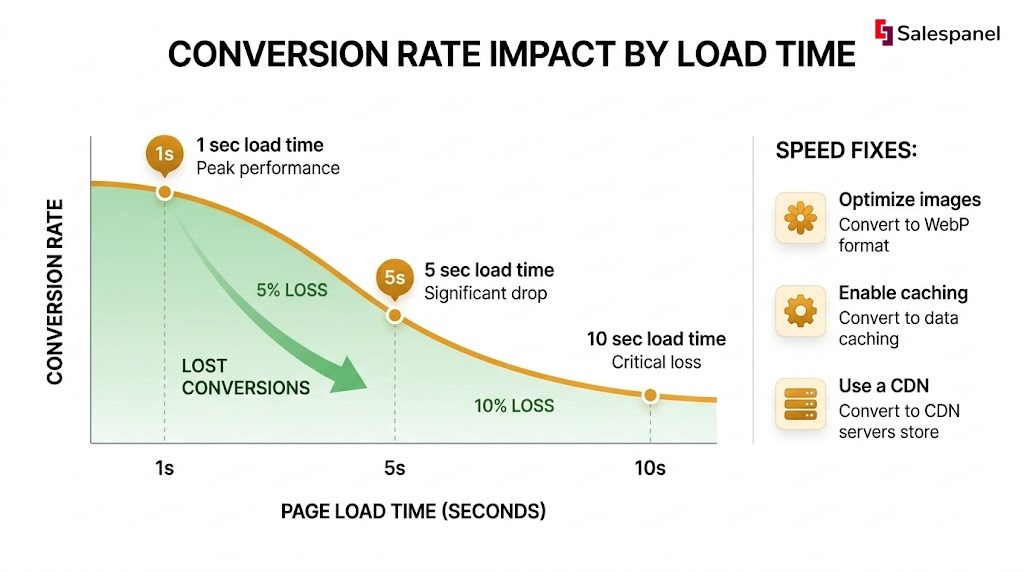
How Website Speed Impacts Conversions
In conversion optimization, website speed is not a mere technical detail; it is a fundamental component of the user experience. A slow-loading website creates immediate friction, testing a visitor’s patience before they have even seen your value proposition.
Each millisecond of latency contributes to a negative impression that is directly correlated with higher bounce rates and lost revenue. Modern users expect instantaneous performance. A page that takes several seconds to render can be perceived as broken or untrustworthy, often driving potential customers to faster competitors.
The Quantifiable Cost of Latency
The financial impact of poor performance is well-documented. Numerous studies confirm a direct link between site load time and conversion rates.
Research demonstrates this clearly: an e-commerce site loading in one second can achieve conversion rates up to 2.5 times higher than a site taking five seconds. As load times extend to ten seconds, conversions can drop to one-fifth of their potential.
This is not a minor inconvenience; it is a significant financial liability that actively undermines all other marketing efforts.
The core principle is that speed is foundational. Even the most compelling copy and an irresistible offer are ineffective if a significant portion of your audience abandons the page before it loads.
Actionable Steps for Improving Site Speed
Improving website performance is a multi-faceted endeavor involving how assets are built, stored, and delivered. Here are several practical strategies.
- Optimize Your Images: Images are often the largest assets on a webpage. Transitioning to modern formats like WebP or AVIF can reduce file sizes by 25-50% compared to JPEG and PNG formats, with no perceptible loss in quality. Additionally, implementing responsive images ensures that devices receive appropriately sized files.
- Use Browser Caching Effectively: Browser caching instructs a visitor’s browser to store static files (CSS, JavaScript, images) locally. On subsequent visits, the browser loads these files from its local cache instead of re-downloading them, resulting in significantly faster load times for returning users.
- Minify CSS and JavaScript: Minification is the process of removing unnecessary characters—such as spaces, comments, and line breaks—from code files. While these characters are helpful for human readability, they are superfluous for browsers. Minifying code reduces file sizes, leading to faster downloads and execution.
The Role of a Content Delivery Network
A Content Delivery Network (CDN) is an essential component for any business with a global or geographically dispersed audience. A CDN is a distributed network of servers that caches copies of your website’s content in various locations worldwide.
When a user visits your site, content is delivered from a nearby CDN server rather than your primary origin server, which may be thousands of miles away. This significantly reduces latency and improves load times for all users, regardless of their location.
A practical example: an e-commerce store’s product page, heavy with high-resolution images, has a load time of 2.8 seconds. After converting images to WebP and implementing a CDN, the load time drops to 1.5 seconds. This 1.3-second improvement can directly lead to a measurable increase in ‘add to cart’ actions and a reduction in page abandonment—a technical fix that translates directly into business growth.
Executing High-Impact Optimization Strategies
With a solid data foundation in place, the focus shifts from analysis to action. This is the core of website conversion rate optimization: using insights to run structured experiments. The objective moves from passively observing user behavior to actively influencing it.
This methodical process transforms abstract data into tangible improvements for users and, consequently, for your bottom line. It is a system where validated learning supersedes guesswork, ensuring each change is a calculated step toward enhanced performance.
Structured Experimentation with A/B Testing
A/B testing, or split testing, is the primary methodology for a rigorous CRO strategy. It functions as a controlled experiment, comparing two versions of a webpage—the original “control” (Version A) and a new “variation” (Version B)—to determine which performs better against a specific goal. This approach eliminates subjectivity by providing statistical evidence of what works.
The process is straightforward but requires discipline:
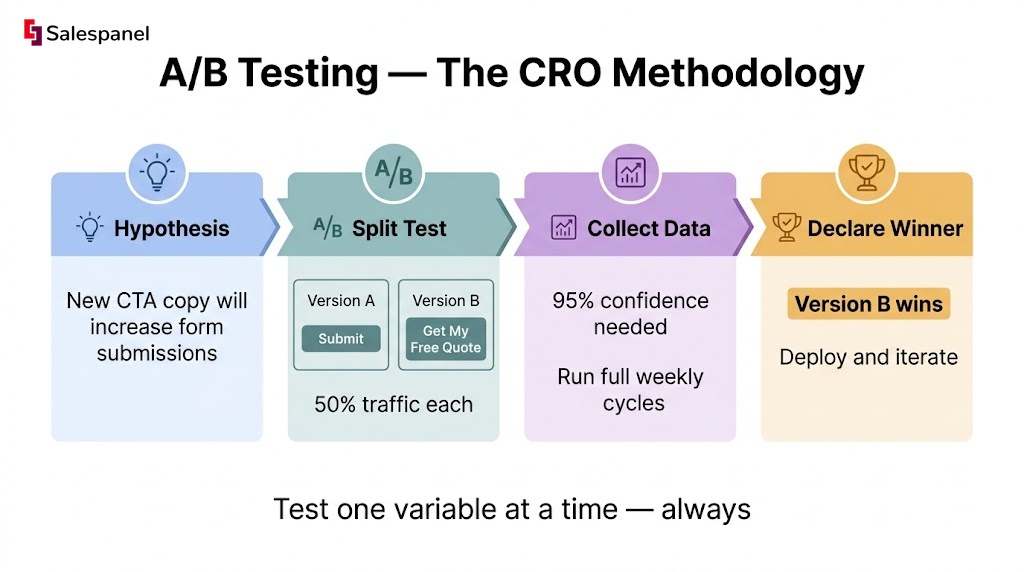
- Start with a clear hypothesis. Data analysis should inform an educated guess. For example: “Changing the CTA button text from ‘Submit’ to ‘Get My Free Quote’ will increase form submissions because the new copy is more specific and value-oriented.”
- Create the variation. Build Version B, modifying only the single element defined in the hypothesis.
- Run the test. Use an A/B testing tool to randomly serve either Version A or Version B to your website traffic.
- Analyze the results. Once sufficient data is collected to achieve statistical significance (typically a 95% confidence level), a winner can be declared.
The golden rule is to test one variable at a time. Modifying the headline, button color, and form layout simultaneously makes it impossible to attribute a change in conversions to a specific element.
Refining Critical Conversion Points
Certain website elements have a disproportionate impact on conversion rates. Focusing optimization efforts on these high-leverage points yields the greatest returns.
Calls-to-Action (CTAs)
CTAs are the gateways to conversion. Experimenting with their copy, color, size, and placement is a fundamental CRO practice.
Practical Example: A “Learn More” button receives a high click-through rate, but few of these users convert. The hypothesis is that the copy is too vague. Test variations like “View Pricing Plans” or “See a Live Demo” against the original. The goal is to determine if more specific, high-intent copy attracts more qualified clicks.
Forms
Forms are often the final barrier to conversion, making them a common source of friction. Each additional field increases the cognitive load and the likelihood of abandonment.
Practical Example: A B2B software company analyzes its demo request form. Version A has eight fields in a multi-column layout. They create Version B, a simplified single-column layout that removes the “Company Size” and “Job Title” fields. The hypothesis is that the shorter, cleaner form will reduce friction and increase submissions, even at the cost of less initial data. The test will reveal which version achieves a higher completion rate.
Connecting Data to Real-Time Personalization
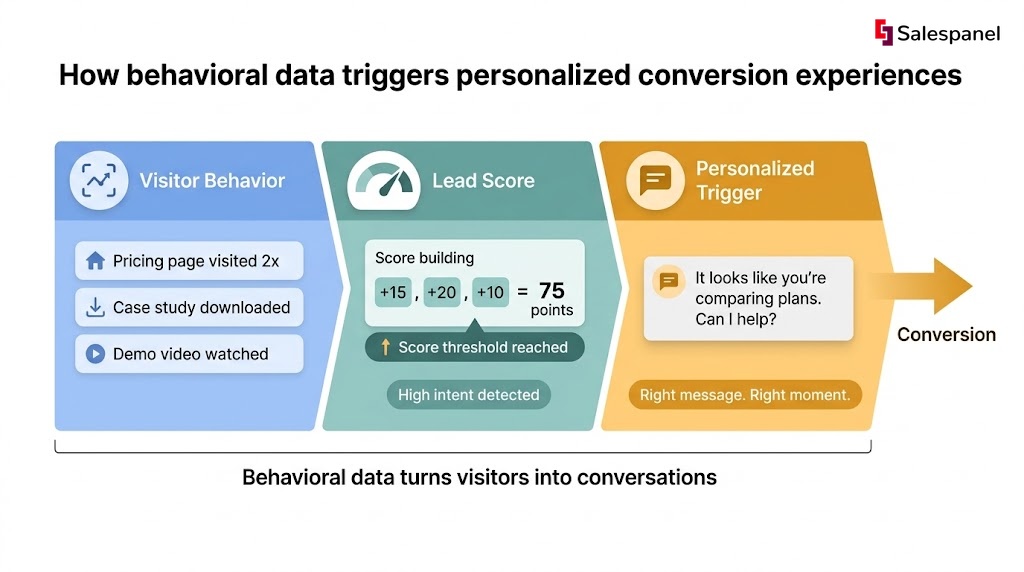
The next evolution of conversion optimization moves beyond static A/B tests to dynamic personalization. This involves using behavioral data to tailor the user experience in real-time based on visitor identity and on-site actions.
This requires a deeper understanding of each visitor. For instance, website visitor tracking from Salespanel can identify high-value B2B leads by analyzing their firmographic data and on-site behavior, such as multiple visits to a pricing page or downloading a specific case study. This rich data is the fuel for effective personalization.
With this intelligence, you can build customized conversion paths. A well-structured lead scoring framework is instrumental here. This screenshot illustrates how Salespanel can assign points for specific actions, like page views or content downloads.
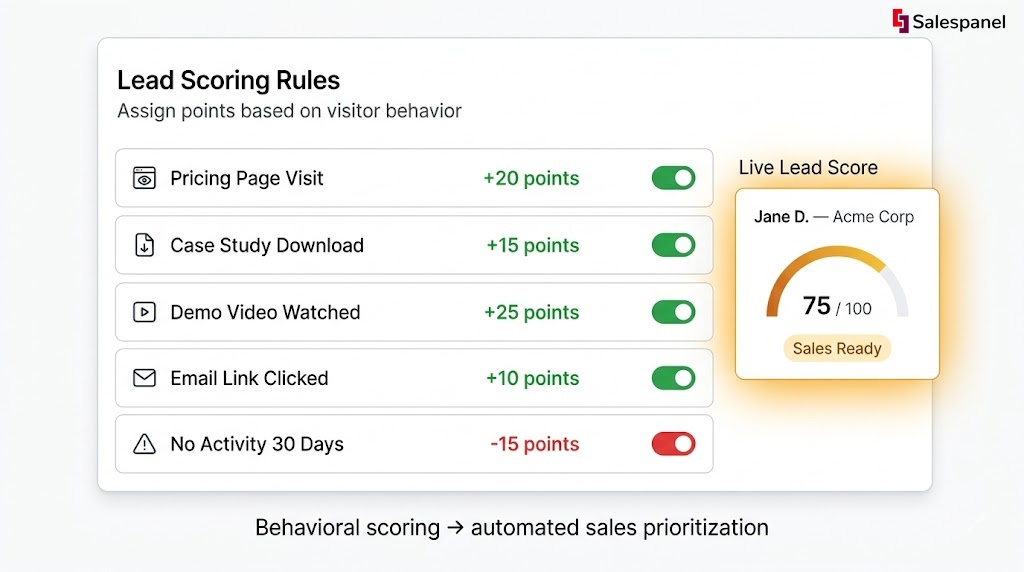
This scoring system is not just for sales; it’s a powerful engine for automating CRO efforts based on visitor intent.
Using Salespanel’s lead scoring framework, you could create a rule that triggers a personalized chat prompt for any visitor reaching a specific score threshold. If a user views your pricing page twice in one week, their score increases, and a chat window can appear with a message like, “It looks like you’re comparing our plans. Can I help you find the right fit?” This targeted engagement intercepts high-intent prospects at the peak of their interest, significantly impacting conversion rates.
Common Questions About Website Conversion Rate Optimization
As you implement a website conversion rate optimization program, several questions inevitably arise. Addressing these common queries upfront will provide clarity and ensure your efforts are effective. The objective of CRO is a cycle of continuous, data-backed improvement—not a single magic fix, but a sustained process of learning and iteration.
What Is a Good Website Conversion Rate?
This is a frequently asked question, but the answer is nuanced: it depends. A “good” conversion rate is relative to your industry, traffic source, and the specific action being measured.
While an average e-commerce rate of 2-3% is often cited, a B2B software company might achieve a 7% conversion rate on a demo request form and consider it a major success. No single number is universally applicable.
The only benchmark that truly matters is your own historical performance. Website conversion rate optimization is about consistently improving upon your own baseline, month over month. Focus on incremental growth rather than chasing abstract industry averages.
How Long Should I Run an A/B Test?
The duration of an A/B test is primarily determined by traffic volume. The goal is to reach statistical significance, typically at a 95% confidence level, to ensure the results are reliable and not due to random chance.
- For high-traffic sites: A statistically significant result may be achieved in a few weeks.
- For lower-traffic sites: The test may need to run for a month or longer to collect sufficient data.
A critical best practice is to run tests for full weekly cycles. User behavior on a Tuesday morning can differ significantly from a Saturday night. Running tests in seven-day increments helps normalize these fluctuations. Never stop a test prematurely, even if one version appears to be leading; this is a common and costly error that can lead to false conclusions.
Can I Do CRO on a Small Budget?
Yes. A large budget is not a prerequisite for starting a CRO program. While premium tools can accelerate the process, a powerful foundation can be built with free resources.
Google Analytics provides a wealth of behavioral data. Free tiers of tools like Hotjar offer heatmaps and session recordings, allowing you to visually analyze user interactions.
The primary investment is not financial but temporal: the time required to analyze data, formulate intelligent hypotheses, and implement changes. Start with high-impact, low-effort tweaks, such as rewriting a confusing headline or removing unnecessary form fields. Meaningful results can be achieved without significant expenditure.
How Do CRO and SEO Work Together?
CRO and SEO are two sides of the same coin, sharing a symbiotic relationship. A superior user experience—the core goal of CRO—is a significant ranking factor for search engines.
When you improve site speed, reduce bounce rates, and increase user engagement time, search engines like Google take notice. These signals indicate that users are having a positive experience, which can lead to improved visibility in search results.
In essence, SEO brings qualified visitors to your site, and CRO ensures they have a positive experience that encourages them to convert. A comprehensive digital strategy integrates both disciplines, recognizing that they work in tandem to not only attract the right traffic but to maximize the value of every visitor.
Ready to turn more of your website traffic into qualified leads? Salespanel provides the tools you need to track visitor journeys, score lead intent, and personalize the user experience to drive conversions. Explore our full suite of resources to see how you can build a more effective marketing and sales engine at Salespanel Resources.